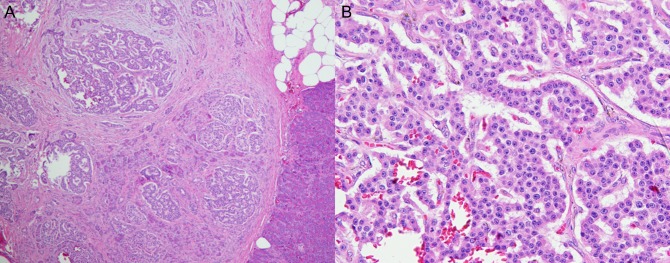
Figure 2:
Pathology from the first operation on the first case study patient. (A) H&E stain at low magnification (×40) shows a well-defined border between the tumor and normal pancreatic tissue (right lower). (B) High magnification (×200) shows the tumor cells forming anastomosing cords, with ‘salt-and-pepper’ chromatin and eosinophilic, granular cytoplasm.

