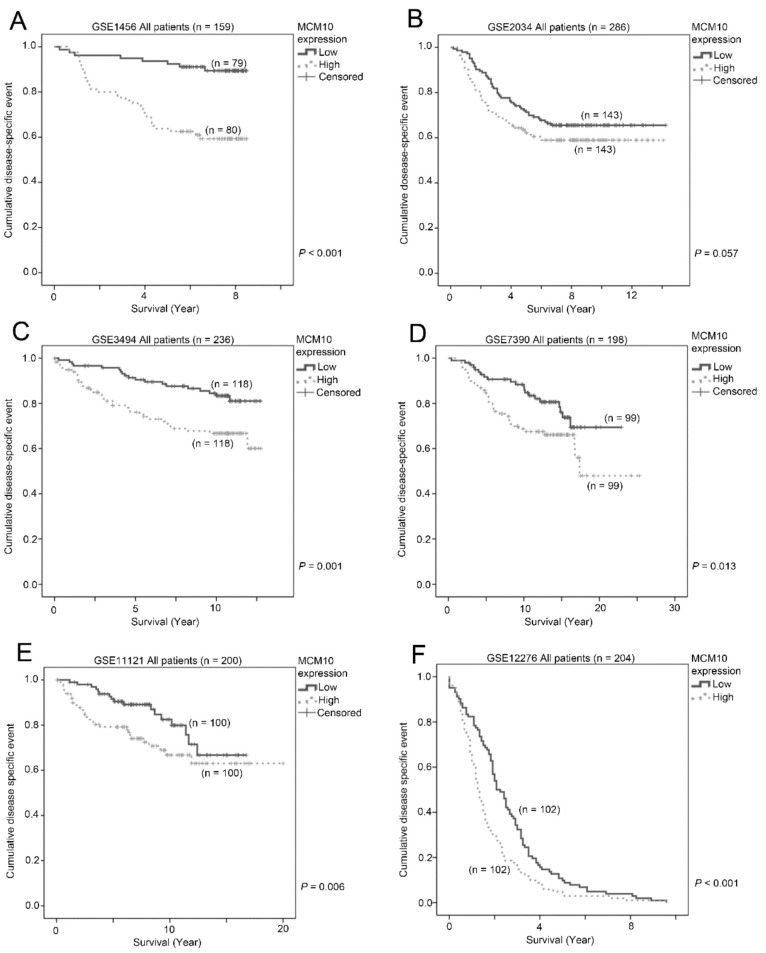
Figure 2.
The association between MCM10 expressions and patient survival. Kaplan-Meier plots showing the proportion of patient survival for those with low or high MCM10 expression levels in breast cancer datasets (A) GSE1456 (n = 159); (B) GSE2034 (n = 286); (C) GSE3494 (n = 236); (D) GSE7390 (n = 198); (E) GSE11121 (n = 200); and (F) GSE12276 (n = 204).

