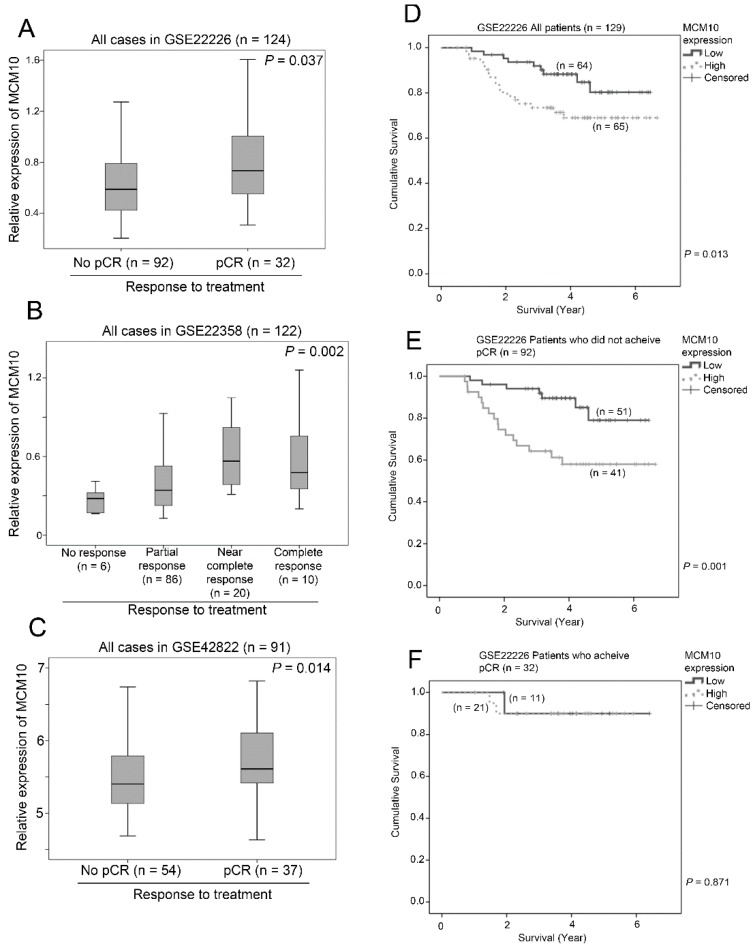
Figure 7.
The association between MCM10 expression and response to neoadjuvant chemotherapy. Box plots showing the mean, 95% confidence interval and range of MCM10 mRNA expression in breast cancer datasets in patients with various response to chemotherapy in (A) GSE 22226 (n = 124); (B) GSE22358 (n = 122) and (C) GSE42822 (n = 91). Kaplan-Meier plots showing proportion of patients survived for those with low or high level expression of MCM10 in GSE22226; (D) the whole patient cohort; (E) patients who did not achieve pCR and (F) patients who achieved pCR.

