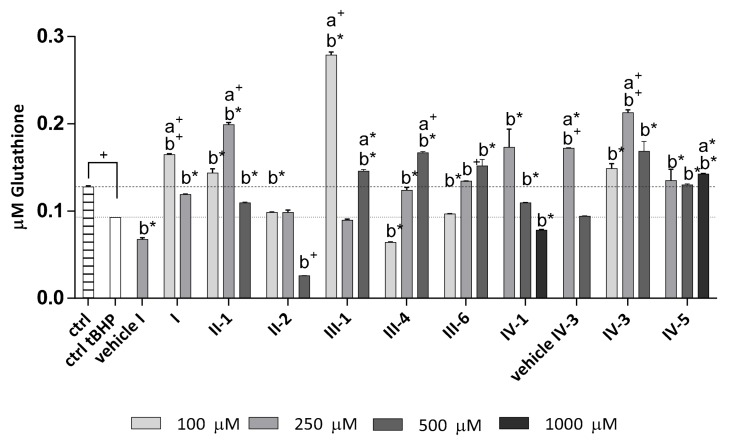
Figure 6.
Concentration of total glutathione in cell lysates after 24-h treatment with DHPs followed by 1-h exposure to mild oxidative stress (50 µM tBHP). Statistically significant difference between DHPs and (a) non-treated control (ctrl (dashed line); only for the significant increase) or (b) treated control (ctrl tBHP (dotted line)) is given as follows: a*/b* p < 0.05; a+/b+ p < 0.005 with the difference between ctrl vs. ctrl tBHP as + p < 0.005. Values are given as mean ± standard deviation, n = 3.

