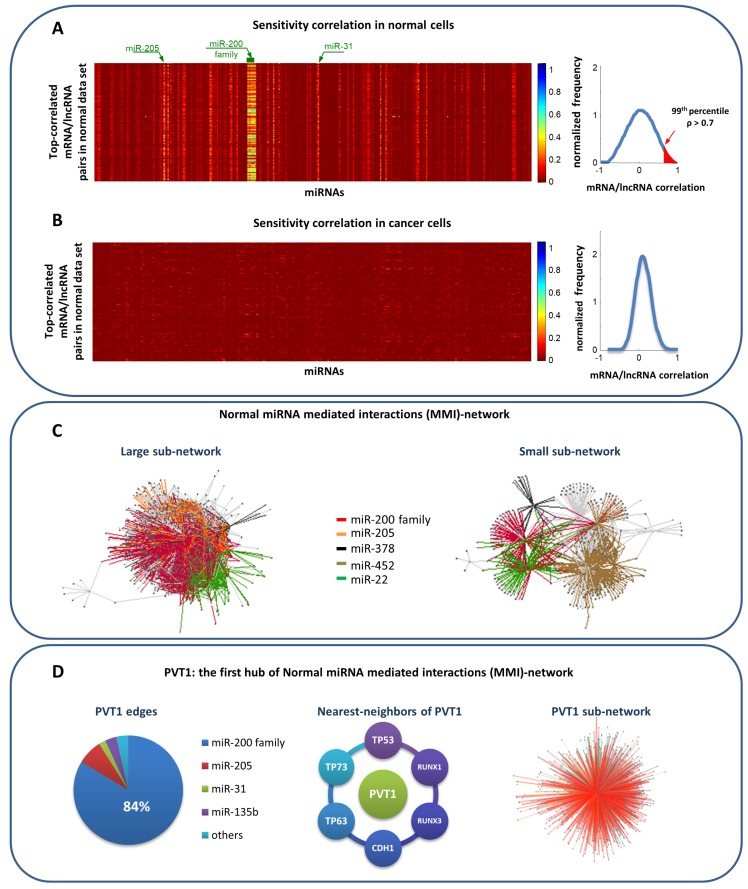
Figure 3.
Results of Paci et al. model to predict miRNA sponge interactions in breast invasive carcinoma [25]. (A) Heatmap showing the sensitivity correlation for the top-correlated mRNA/lncRNA pairs (e.g., pairs for which the Pearson correlation between their expression profiles exceeds the 99th percentile of the overall correlation distribution) in normal breast tissues. Red color corresponds to zero sensitivity correlation, meaning that the interaction between the selected RNA pairs is direct and not mediated by miRNAs. Light vertical stripes point to miRNAs that are mediating the interaction, suggesting putative competing endogenous RNAs. (B) The same as in panel (A) but using data from breast cancer tissues. (C) The normal MMI-network (1738 nodes and 32,375 edges) built starting from the expression data of normal breast tissues. Nodes represent both mRNAs and lncRNAs; edges represent miRNAs that are mediating their interactions. Each pair of linked nodes fulfills two requirements: (i) sensitivity correlation > 0.3 and (ii) one or more shared MREs, for each miRNA linking them. Colors correspond to different miRNAs. (D) PVT1 subnetwork analysis. From left to right: the percentage of the miRNAs sponged by PVT1 with respect to all of its; some nearest neighbors of PVT1 that are well-known cancer genes; the sponge interactions sub-network of PVT1 (753 nodes and 2169 edges).

