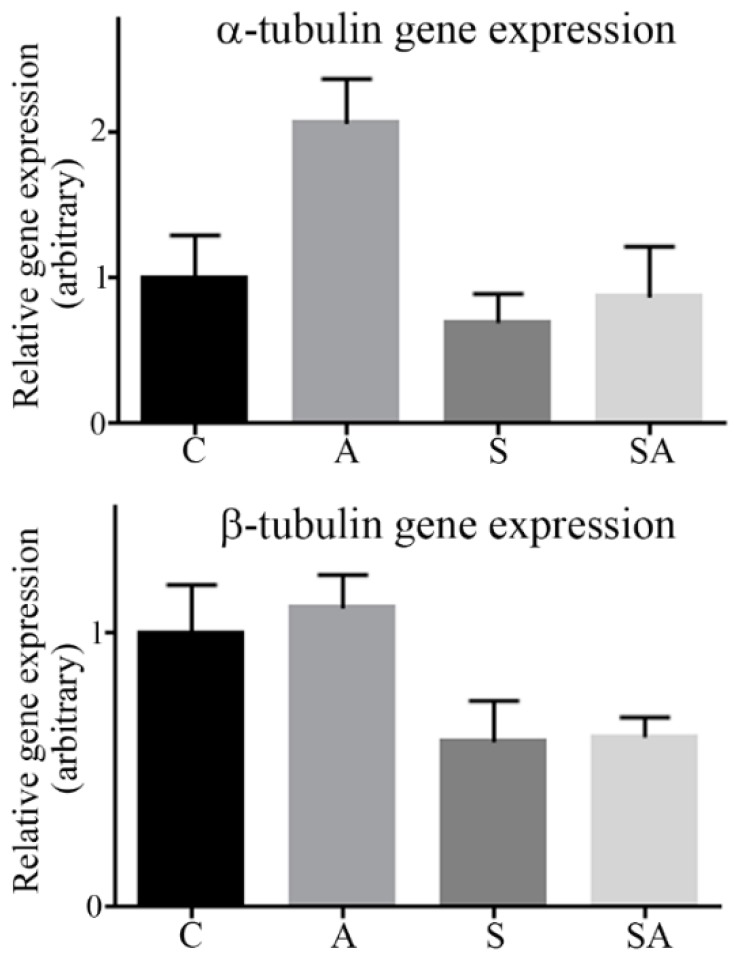
Figure 4.
Quantitation of α- and β-tubulin gene expression by qRT-PCR. Relative gene expression of α-tubulin and β-tubulin in control (C), alcoholic (A), suicide (S), and suicide alcoholic (SA) patients was quantified using qRT-PCR. Expression of the genes beta actin, beta-2-microglobulin, and tyrosine 3-monooxygenase/tryptophan 5-monooxygenase activation protein zeta were used as housekeeping genes. Histograms are representative of means ± SDs, n = 6. Control values were set at 1.

