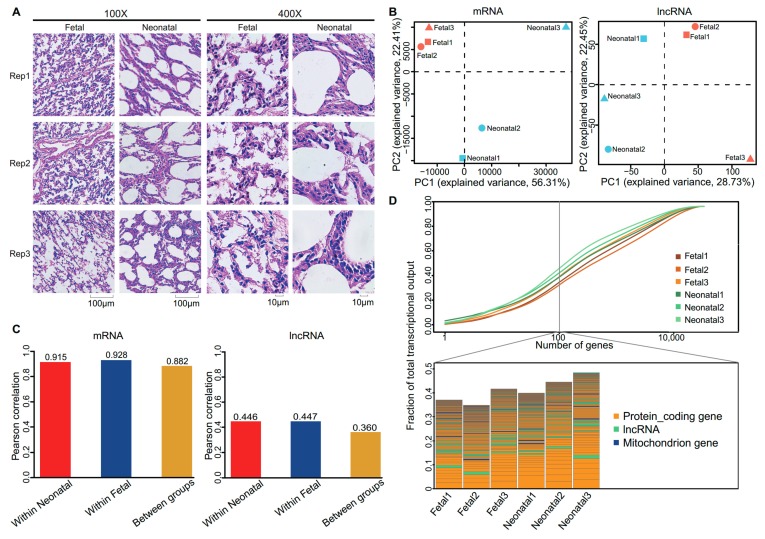
Figure 1.
(A) Magnified images of the lungs in fetal and neonatal groups (Left: 100×; Right: 400×). Rep1, rep2, and rep3 are representative of tripartite biological replicates. (B) Principal component analysis (PCA) was performed on the expression levels of messenger RNA (mRNA) and long non-coding RNA (lncRNA) with log2-transformed FPKM (fragments per kilobase per million mapped reads) values. (C) Pearson correlation coefficients between samples in the same group or between two groups. (D) The complexity of total (mRNA and lncRNA) transcripts. Top: Cumulative measures of the fraction of total transcripts contributed by mRNA and lncRNA (all transcripts were sorted from most-to-least). Bottom: Biological type and relative contribution to total transcripts of the top-100 expressed genes or transcripts. Height of the bar shows the relative contribution of transcripts to the total. PC: Principal component.

