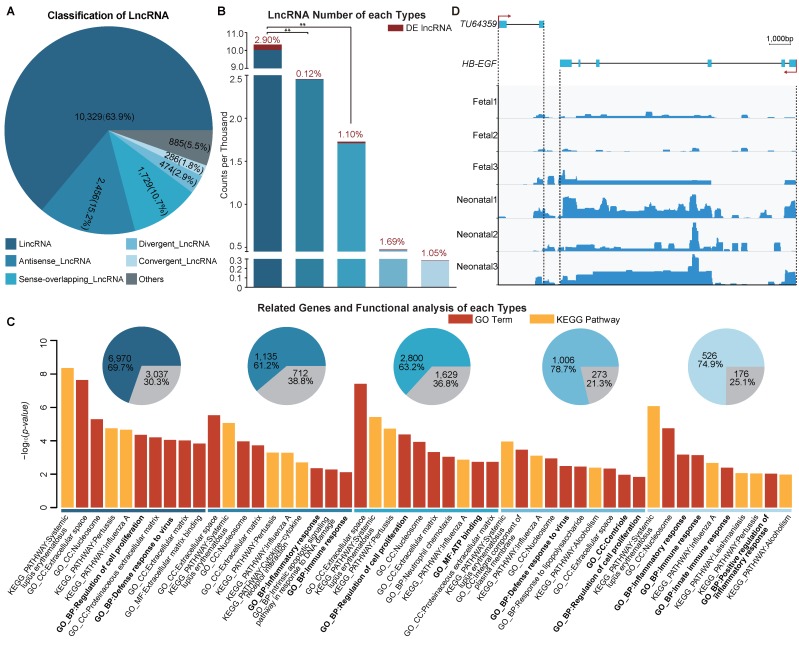
Figure 4.
Classification and functional enrichment analysis of lncRNAs. (A) Classification of lncRNAs: proportion and number of each type is shown in the pipe plot; (B) lncRNA number for the different types: bars represent the counts for different types, DE lncRNAs numbers and ratios are labeled in red, χ-squared tests were performed on the counts between lincRNAs with other types. (C) Related genes and functional enrichment analysis of different lncRNA types: highly related genes for DE lncRNA of different types shown in pie plots (DE mRNAs are labeled in gray), top ten categories (p < 0.05) are listed in bar plots after enrichment analysis by DAVID, DE mRNAs were set as gene list and all related genes as background. Categories related to cell proliferation, immune response and mitochondrial activation are in bold font; (D) Loci and expression levels of TU64359 and HB-EGF read abundance which was generated by integrative genomics viewer (IGV) v.2.4.10 [74]. **: p < 0.01.

