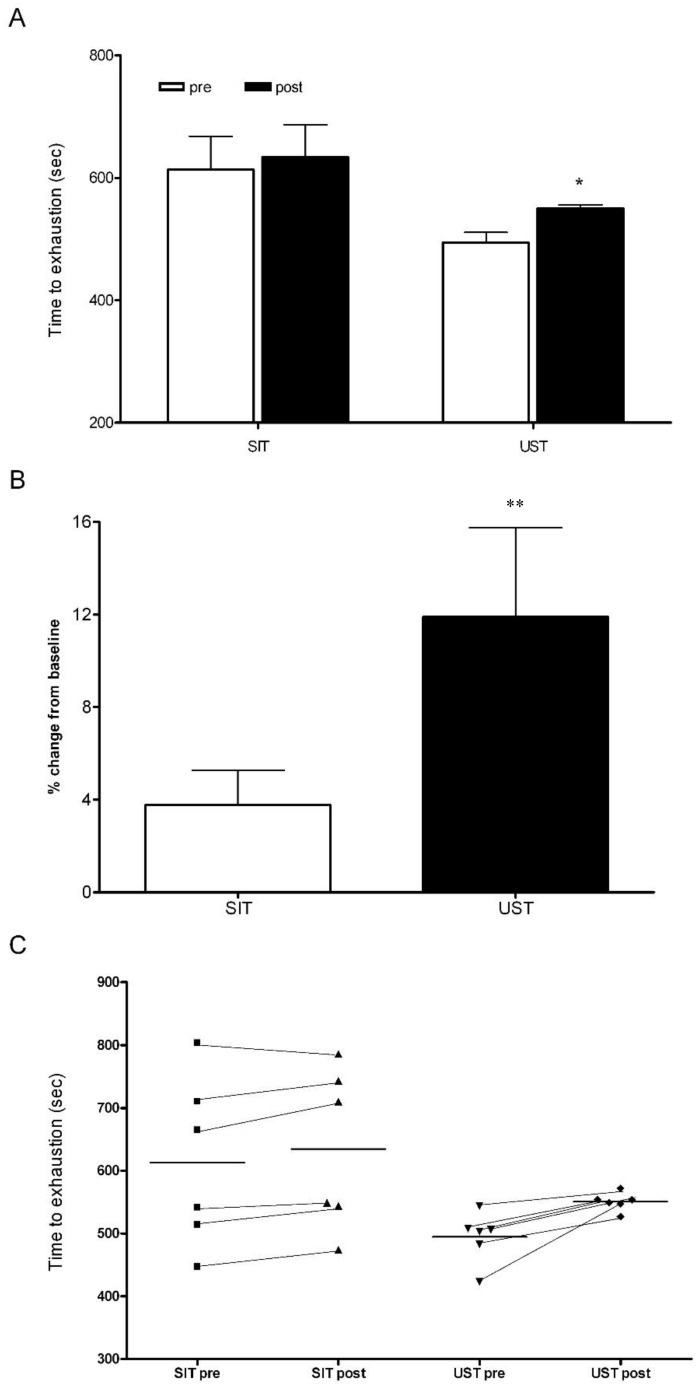
Figure 1.
Absolute percentage and individual changes in time-to-exhaustion in SIT and UST groups. (A) Absolute changes pre-SIT and post-SIT and UST, * p < 0.05 pre-compared to post; (B) Percentage change from the baseline in SIT and UST groups, ** p < 0.05 SIT compared to UST; (C) Individual changes in time-to-exhaustion pre-SIT and post-SIT and UST.

