Figure 2.
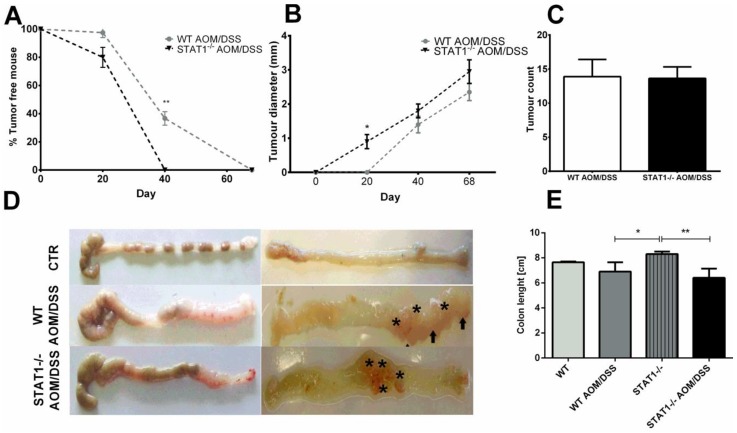
STAT1 deficiency leads to rapid development of CAC. Colons were removed and the number of macroscopic tumors were determined at the indicated time intervals. (A) Time course of the percentage of tumor-free mice during the AOM/DSS treatment in WT and STAT1−/− mice. (B) Tumor diameter (mm) of colorectal tumors formed in WT AOM/DSS and STAT1−/− AOM/DSS animals at the indicated times. (C) Number of colorectal tumors per mouse 68 days after AOM administration. (D) Representative photographs of the colon 68 days after the AOM injection (asterisks and arrows point to the tumors). (E) AOM/DSS treated mice had significantly smaller colons than control mice. Total data (A,B,C,E) and representative data (D) of two independent experiments with at least three mice per group. Data are expressed as means ± SDs. Statistically significant differences between two groups were judged by the Student’s t-test. * p ≤ 0.05, ** p ≤ 0.01.

