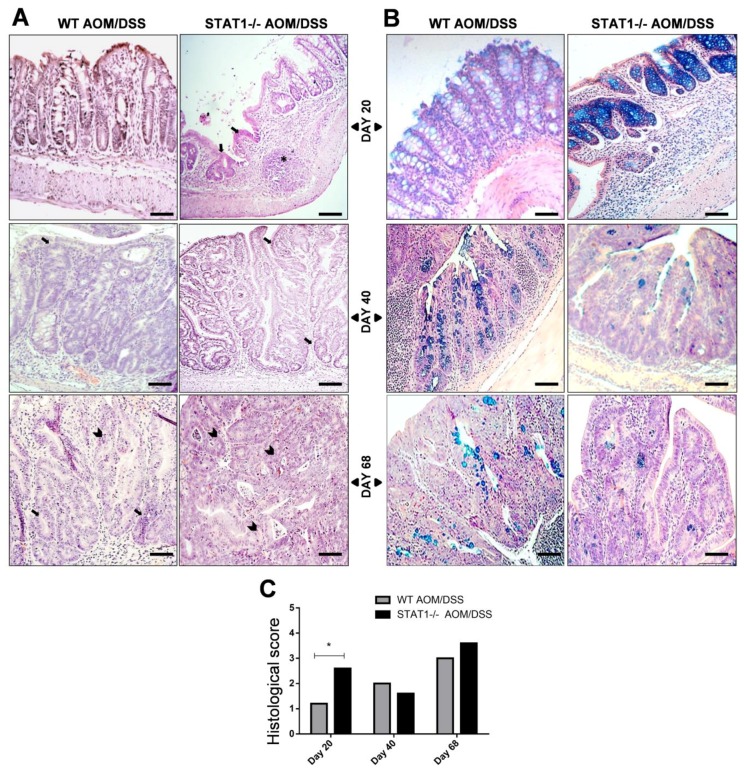
Figure 3.
STAT1 deficient mice have more advanced dysplasia and goblet cell decreases compared to WT colons. The colons were removed, fixed, and stained with H&E (A) or Alcian blue (B) at the indicated time intervals. (C) The histological score shown in each group of mice was determined as mentioned in M&M and is expressed as mean ± SD. Scale bars: 50 µm. * indicate hyperplastic lymphoid node, arrow indicate numerous hyperplastic gland polyps and arrowhead atypical epithelial cells with dysplastic nucleus and mitotic figures. A remarkable decrease of goblet cells was observed at Day 40 in STAT1−/− AOM/DSS. Demonstrative photographs and data are representative of two independent experiments with at least three mice per group per day of the analysis. Statistically significant differences between two groups were judged by Student’s t-tests. * p ≤ 0.05.

