Figure 1.
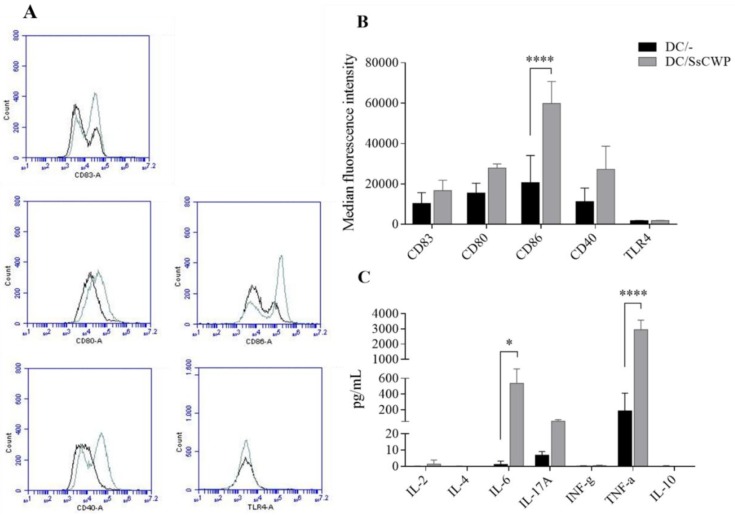
Phenotypical analysis of stimulated bone-marrow-derived dendritic cells (BMDCs). (A) Histograms representative of expression analysis of CD80, CD86, CD40, and TLR-4 (cellular activation markers) and CD83 (maturation marker) in BMDCs stimulated or not with SsCWP. (B) Cell surface expression of indicated markers on BMDCs. (C) Cytokine concentration in the culture supernatant of BMDCs. The data are presented as the mean ± SD of 3 three culture of pooled cells obtained from bone marrow of mice and the expression of markers are presented as their median fluorescence intensity (MFI). DC/-: unstimulated BMDCs (black line); DC/SsCWP: SsCWP-stimulated BMDCs (grey line). Asterisk indicates statistically significant difference between unstimulated and SsCWP-stimulated BMDCs: * (p < 0.05) and **** (p < 0.0001) as indicated. DC: dendritic cell. SsCWP: Sporothrix schenckii cell wall protein.

