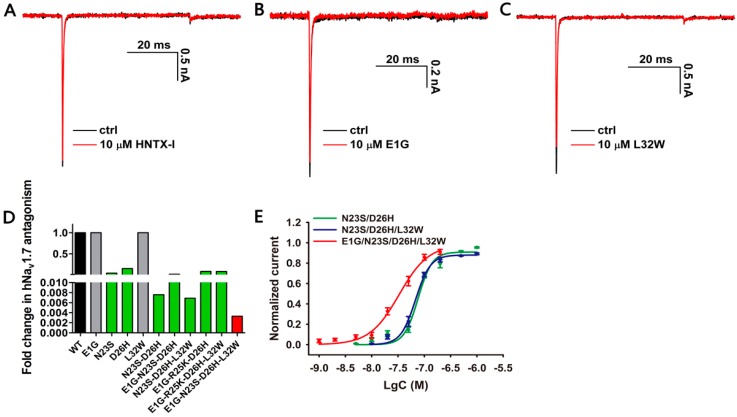
Figure 2.
Inhibitory activity of HNTX-I analogues on NaV1.7. (A) Representative NaV1.7 current trace before (black) and after (red) addition of 10 µM wild-type HNTX-I; (B) Representative NaV1.7 current trace before (black) and after (red) addition of 10 µM E1G; (C) Representative NaV1.7 current trace before (black) and after (red) addition of 10 µM L32W; (D) Fold change of inhibitory effect of wild-type HNTX-I and HNTX-I analogues on NaV1.7; (E) Concentration–response curves of N23S–D26H, N23S–D26H–L32W and E1G–N23S–D26H–L32W analogues assessed by whole-cell patch clamp. Data are mean ± SEM, with n = 3–5 cells per data point.

