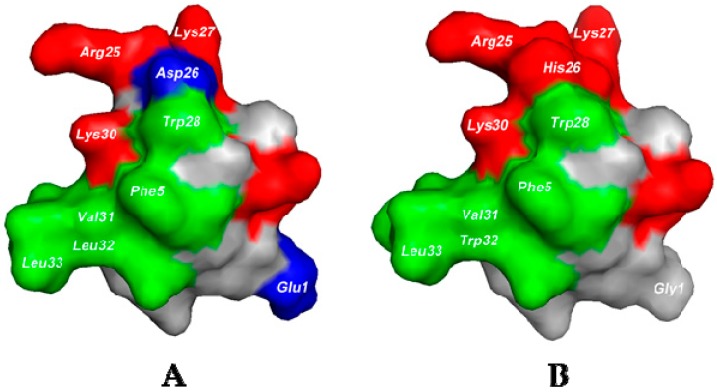
Figure 3.
Surface rendering of NMR structure of HNTX-I and HNTX-I analogue E1G–N23S–D26H–L32W. (A) Surface rendering of HNTX-I (PDB code 1NIX); (B) Surface rendering of a homology model of HNTX-I analogue E1G–N23S–D26H–L32W. Positively charged residues are shown in red, negatively charged residues in blue, hydrophobic residues in green, and polar uncharged residues in gray. This figure was generated using PyMOL.

