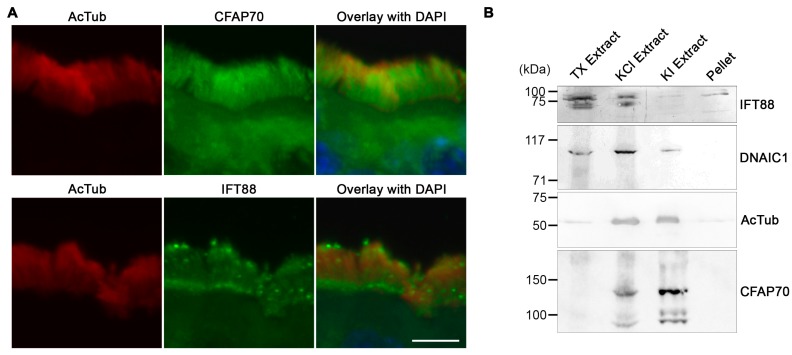
Figure 2.
Comparison of the intra-ciliary distribution between CFAP70 and IFT88. (A) Confocal microscopy of mouse tracheal tissue immunostained for CFAP70 (top panels) and IFT88 (bottom panels). Bar, 5 µm. (B) Isolated swine tracheal cilia were extracted sequentially with 0.1% Triton X-100, 0.6 M KCl, and 0.6 M KI. The resulting supernatants (TX, KCl, and KI, respectively) and final pellet were analyzed by Western blot using antibodies against the indicated ciliary proteins. To the left of the gel, the positions and sizes (kDa) of molecular weight standards are indicated.

