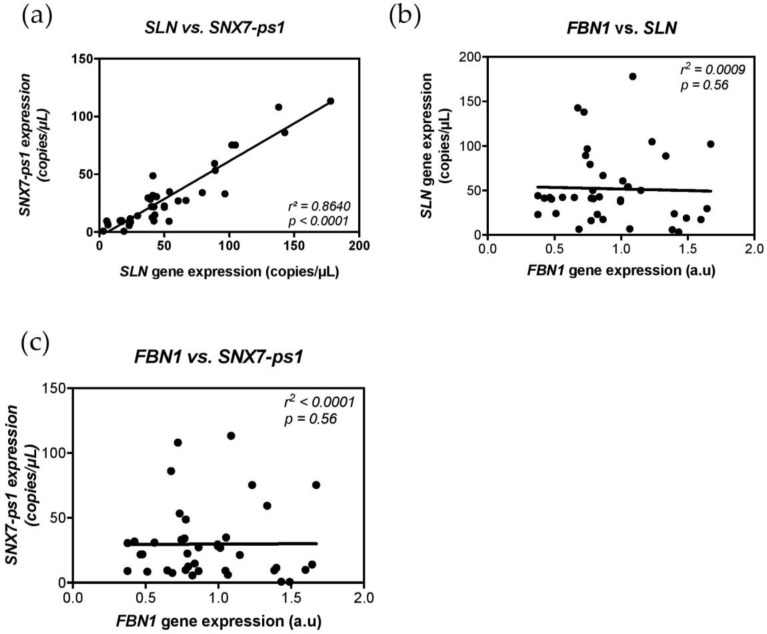
Figure 2.
Correlation of expression levels between FBN1 SLN and SNX7-ps1 gene. (a) Gene expression levels were assessed using digital droplet PCR (ddPCR). Positive correlation of expression was observed between the nearest gene of the lead SNP, SLN and SNX7-ps1 (r2 = 0.86, p-value < 0.0001). (b) Correlation plot between FBN1 and SLN expression. No correlation was found (r2 = 0.0009, p-value = 0.56). (c) Correlation plot between FBN1 and SNX7-ps1 expression. No correlation was found (r2 < 0.0001, p-value = 0.56).

