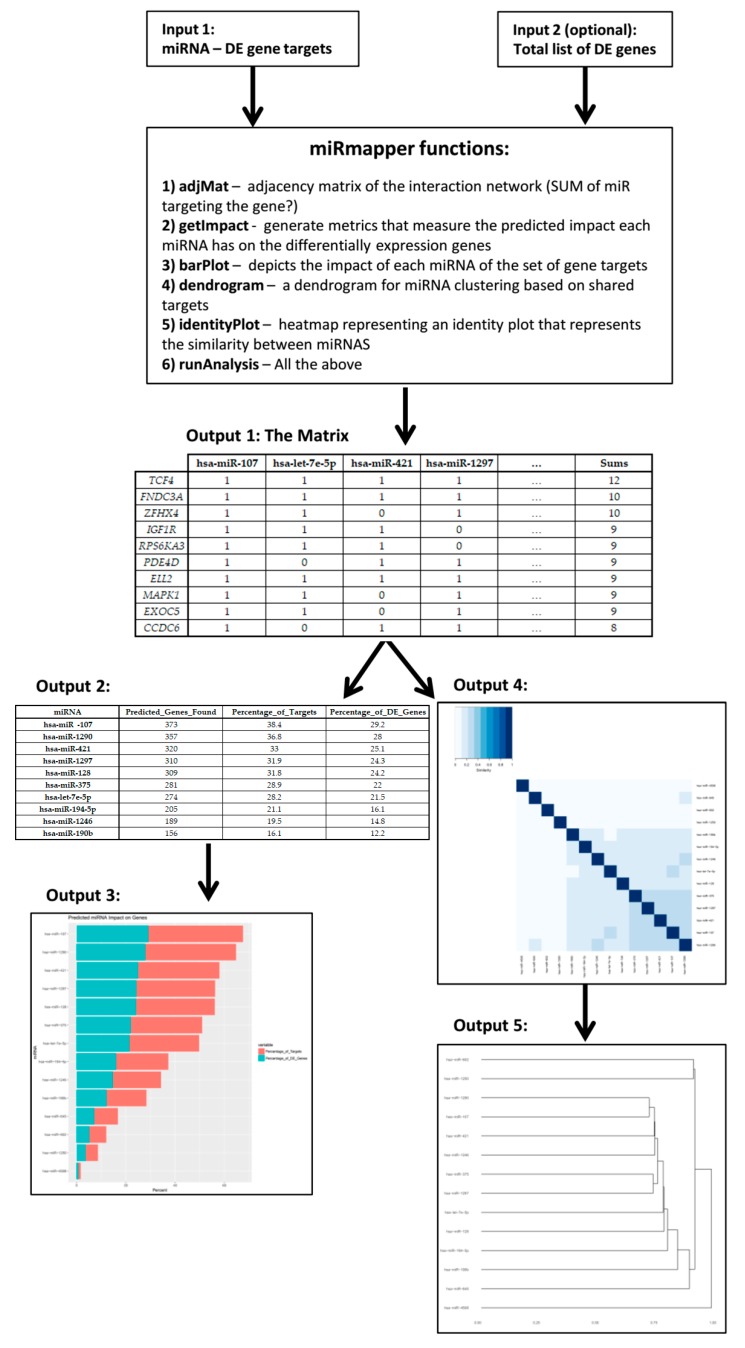
Figure 2.
The miRmapper workflow. An miRNA-gene interaction data frame is the required input for the tool (Input 1), additionally a list of total differentially expressed (DE) genes can be used in conjunction (Input 2). The use of the miRmapper functions will provide an adjacency matrix of the miRNA-genes interactions with gene centrality (Output 1), from this a table is generated with the miRNA impact on gene expression (Output 2) and the graphical representation of that impact (Output 3). Also from Output 1, the structural similarity of miRNAs networks is calculated and graphically represented as an identity plot (Output 4) and as a dendogram (Output 5).

