Figure 3.
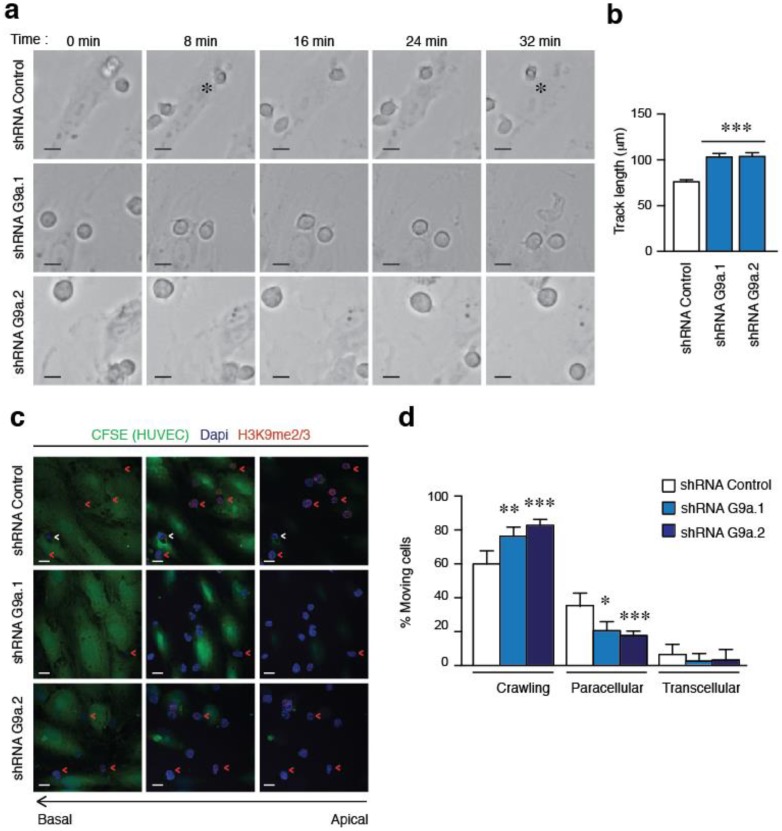
G9a depletion abrogates the TEM of ALL cells. (a) Representative images of control or G9a depleted Jurkat cells migrating on TNFα-activated HUVEC cells. Cells were tracked through time. Asterisk indicates a transmigrating cell. Bar = 10 μm (b) Control or G9a depleted Jurkat cells were labelled with CFSE to track their movement on TNFα-activated HUVEC monolayer. Graph shows the quantification of track lengths. Mean n = 200 cells ± SEM. *** p < 0.001; (c) Control or G9a depleted Jurkat cells were plated on TNFα-activated HUVEC cells labelled with CFSE. After 30 min, cells were fixed, permeabilized and analyzed to visualize their nuclei (blue), F-actin (cyan), and H3K9me2/3 (red). White arrows indicate cells undergoing transcellular TEM. Red arrows indicate cells crossing through cell-cell junctions in paracellular TEM; (d) Graph shows the percentage of control or G9a depleted cells crawling or performing TEM. Mean n = 5 ± SD. Bar = 10 μm. * p < 0.05; ** p < 0.01; *** p < 0.001.

