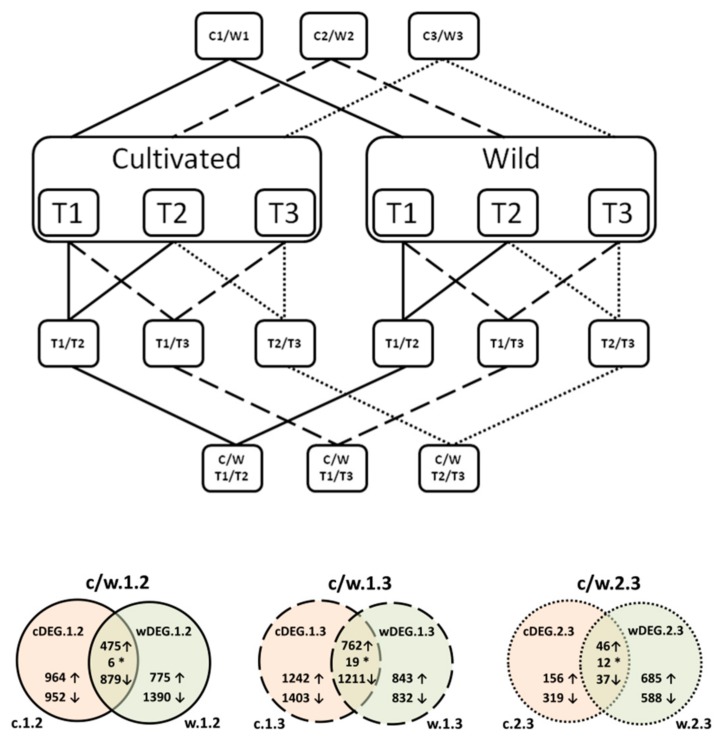
Figure 1.
A diagram illustrating the applied experimental strategy and Venn diagrams showing numbers of differentially expressed genes (DEGs) identified in comparisons between wild (w) and cultivated (c) carrots in each of the three timepoints. ↑—upregulated genes; ↓—downregulated genes; *—genes with discordant expression patterns between wild and cultivated carrots.

