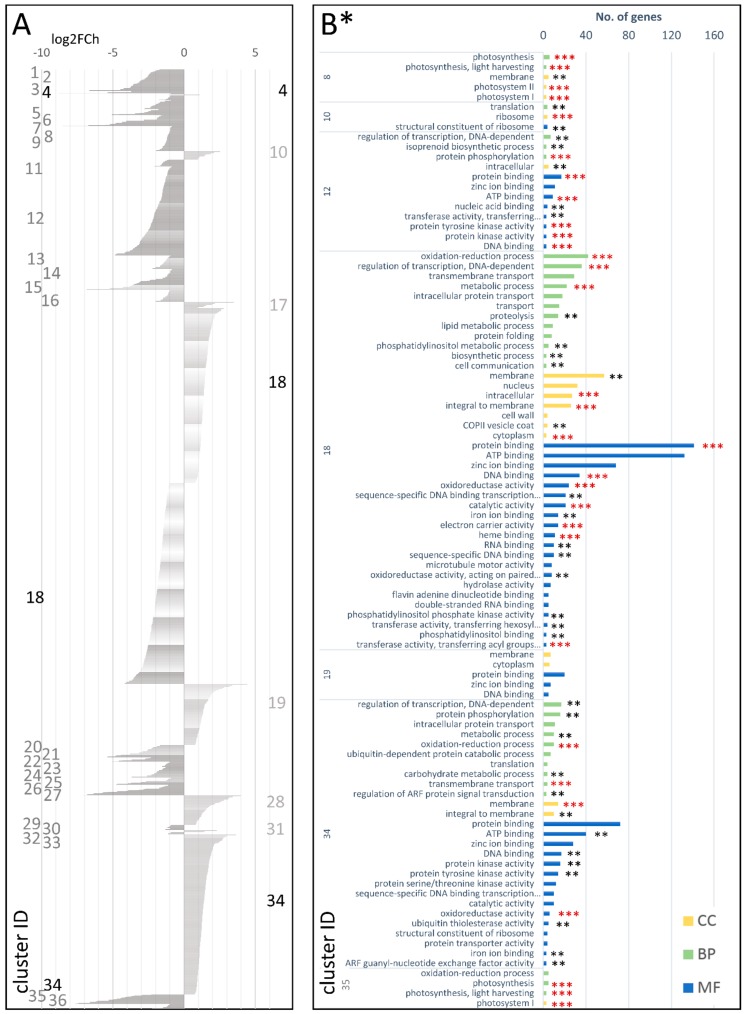
Figure 5.
Clusters of DEGs in the cultivated carrot (young plant v. mature root; cDEG.1.3) showing log2FoldChange values (A) and GO enrichment results (B). Several clusters and enrichment terms in (B) were omitted for the clarity of presentation. CC—cellular component; BP—biological process MF—molecular function; *—number of genes in set >2; **—adjusted p-value < 0.01; and ***—adjusted p-value < 0.001.

