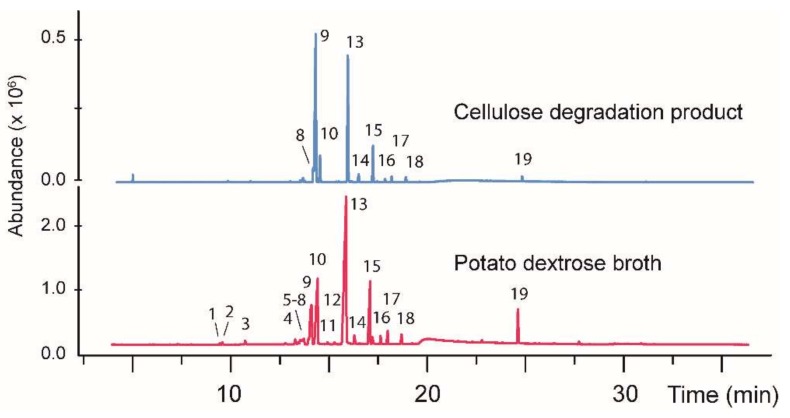
Figure 1.
A gas chromatogram showing the volatile organic products produced by the fungus CI-4 growth on a conventional media (bottom) versus a diet containing carbohydrates produced from cellulose degradation (top). The nominal masses for each numbered peak are given in Table 2. In each case a control sample was also analyzed consisting of the growth medium without fungi added. This solution was processed identically to the fungi-containing samples. In each case, no peaks from the control samples corresponded to any of the peaks shown above.

