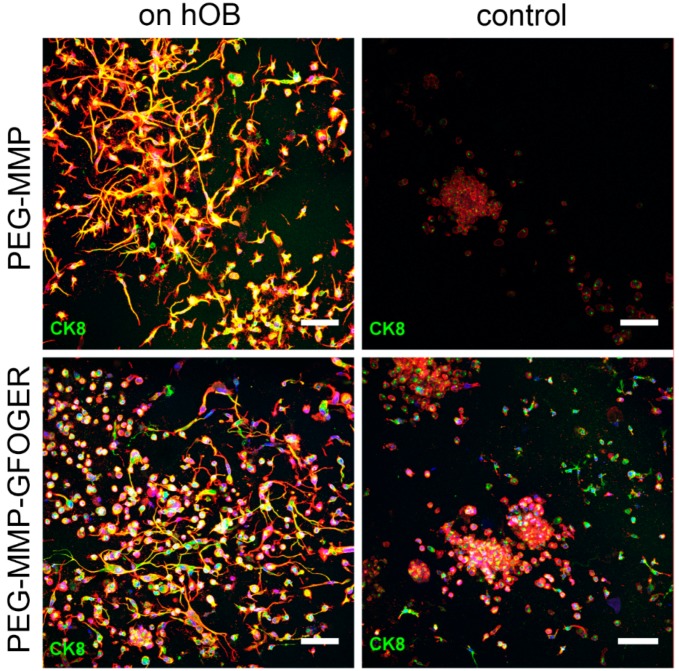
Figure 4.
Maximum projection and 3D reconstruction images of MDA-MB-231 cultured on hOBs in a 2D–3D coculture model. Cells were either cultured in PEG–MMP (γ = 1) (top row) or PEG–MMP–GFOGER (γ = 1.25) (bottom row) hydrogels for 21 d. Cells cultured on hOBs in both hydrogel types showed long protrusions in comparison to more spherical control cells. Staining represents f-actin (red), nuclei (blue), and CK8/18 staining (green). Scale bar = 100 µm.

