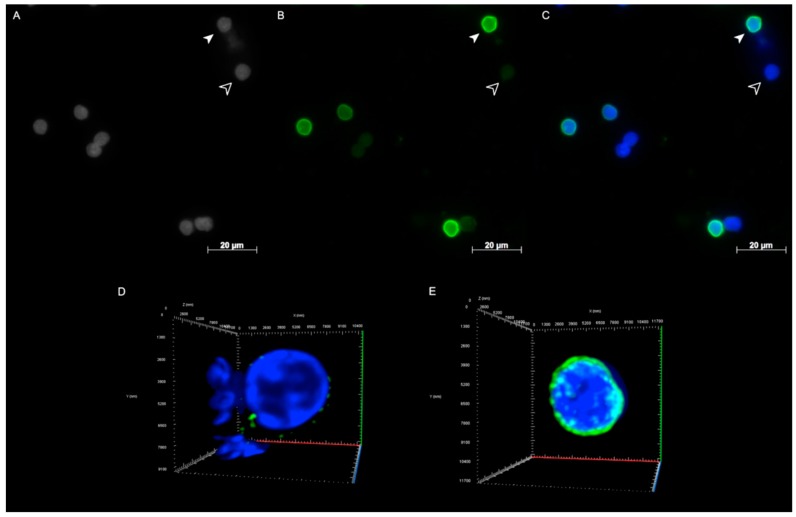
Figure 2.
Lamin A/C immunostaining of resting and LPS-activated lymphocytes from peripheral blood (PB) of a healthy donor. (A) 2D image of nuclei stained with DAPI (gray scale); (B) 2D image of anti-lamin A/C antibody immunostaining (green); (C) 2D merged image showing activated lymphocytes with a higher fluorescence intensity lamin A/C signal (solid arrowhead) compared to resting cells (empty arrowhead). Complete 3D reconstitution of a resting (D) and an activated (E) lymphocyte.

