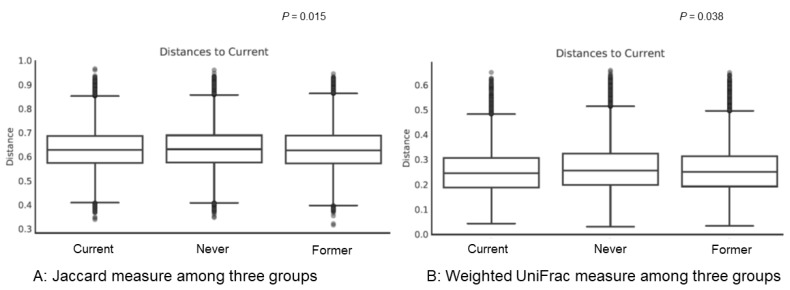
Figure 2.
Beta diversity among groups. (A) Results of beta diversity using Jaccard measure among current smokers, former smokers, and never smokers; (B) results of beta diversity using weighted UniFrac measure among current smokers, former smokers, and never smokers. The y-axes represent the distance of each group to the current group (baseline). The line in each box means the median of data. In both Jaccard measure and Weight UniFrac measure, p-values among three groups were estimated using permutational multivariate analysis of variance (PERMANOVA). PERMANOVA of the diversity analysis was calculated with the 999 Monte Carlo permutation and Benjamini–Hochberg correction (FDR).

