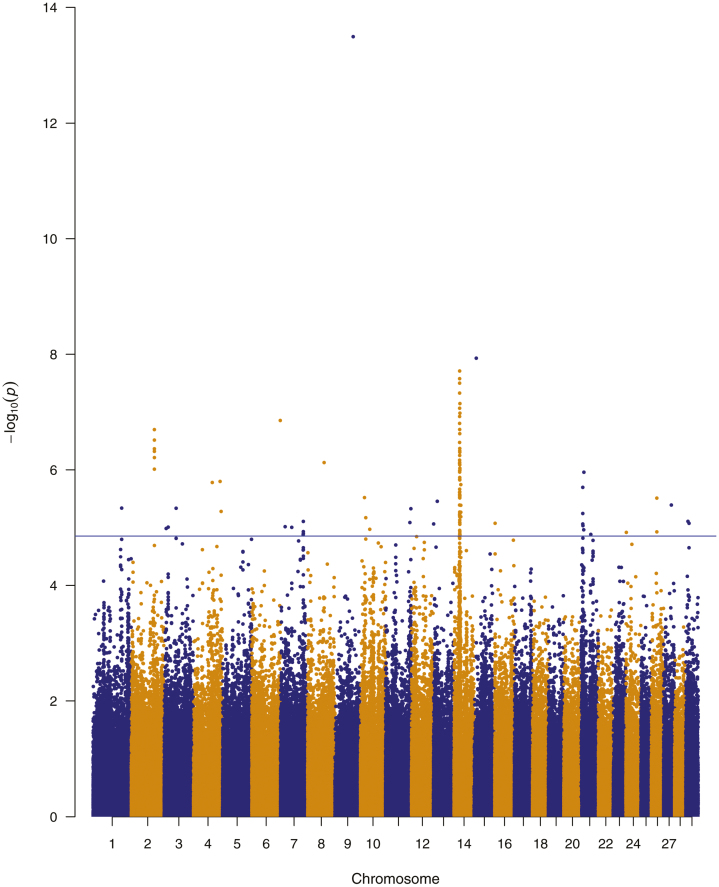
Figure 1.
Manhattan plot of the meta-analysis for sexual precocity traits in Nellore and Brahman cattle. The y-axis represents the log inverse P-values for SNP associations and the x-axis represents the position in base pairs from chromosome 1 to 29. The blue line indicates genome-wide significance, a P-value cutoff of P < 1.39 × 10⁻⁵, which is equivalent of an FDR lower than 5%.

