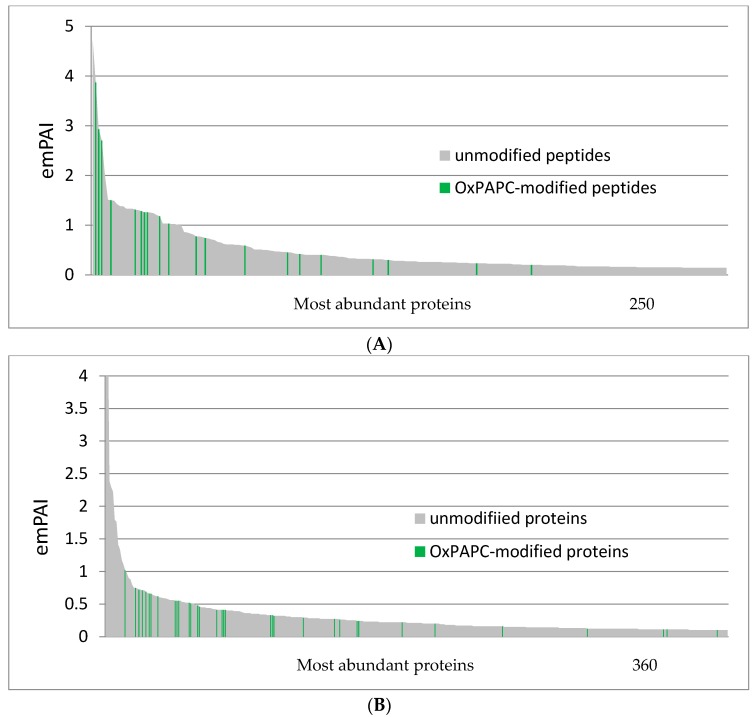
Figure 5.
Protein abundance, based on exponentially modified protein abundance index (emPAI) score. Most abundant proteins, representing ~85% of total proteins, were plotted. The property of proteins to be modified by OxPAPC is not a simple function of their abundance. (A) PBS-soluble proteins; and (B) PBS-insoluble/RIPA-soluble proteins.

