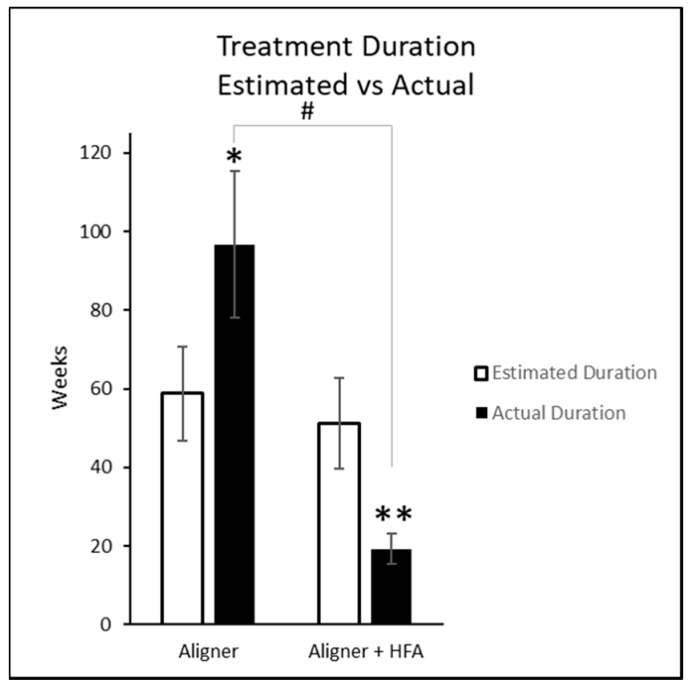
Figure 2.
Estimated and actual treatment durations. * = Actual treatment duration for Aligner group significantly longer than estimated p < 0.005. ** = Actual treatment duration for Aligner + HFA significantly shorter than estimated p < 0.001. # = Actual treatment duration for Aligner + HFA group significantly shorter than Aligner group, p < 0.001.

