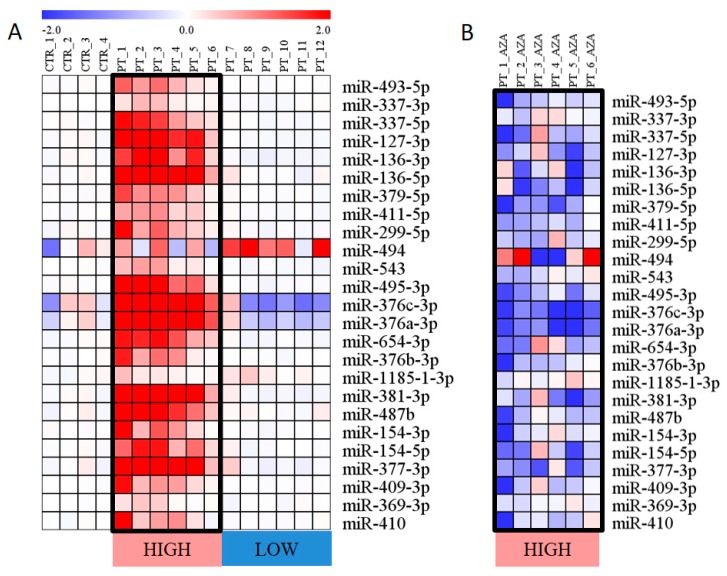
Figure 2.
Expression of miRNAs encoded in the DLK1–DIO3 region. (A) miRNA expression in untreated patients (PT) and healthy controls (CTR). The expression level is calculated as the binary logarithm of fold change (logFC) compared to the mean expression of controls. The miRNAs are aligned in the heatmap according to their location on chr14. (B) Reduction of miRNA expression following AZA treatment. The changes in miRNA levels are calculated as the logFC between paired samples (AZA treatment vs. pretreatment). Only those patients with miRNA overexpression before treatment are shown. Both heatmaps use a color gradient intensity scale to express visually the logFC values in a range of colors (blue—downregulation, red—upregulation, white—unchanged expression).

