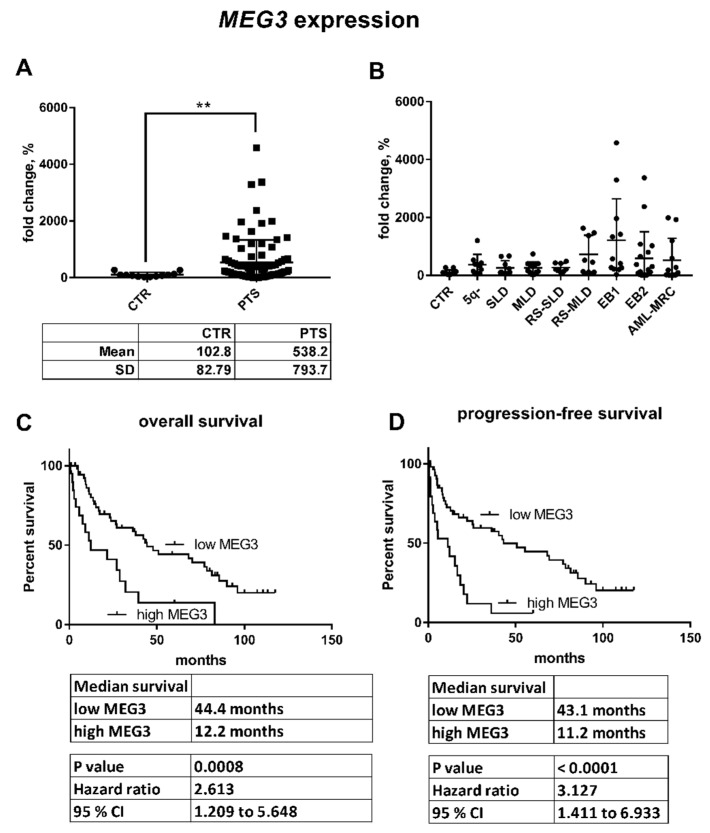
Figure 3.
Relative MEG3 expression in the validation cohort of MDS/AML-MRC patients. (A) The expression of MEG3 was significantly different between healthy controls (CTR) and all patients (PTS) (** p < 0.01). (B) Further distribution of the patients according to their diagnosis revealed increased expression of MEG3 particularly in the patients with advanced disease. (C) Overall survival and (D) progression-free survival of patients with low vs. high MEG3 expression (the cut-off was set up to mean level of MEG3).

