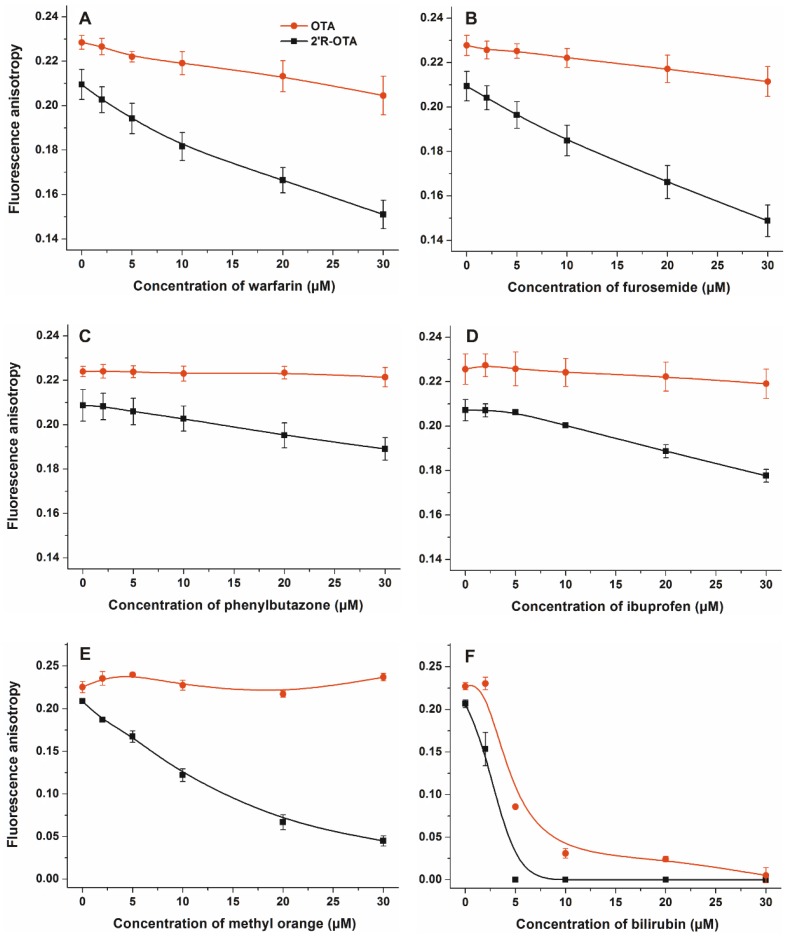
Figure 5.
Fluorescence anisotropy values of mycotoxin-HSA complexes (1 µM OTA or 2′R-OTA and 1.5 µM HSA) in the presence of increasing concentrations of site markers (0–30 µM) in PBS (pH 7.4) ((A):warfarin, (B) furosemide, (C) phenylbutazone, (D) ibuprofen, (E) methyl orange, and (F) bilirubin; λex = 394 nm, λem = 447 nm).

