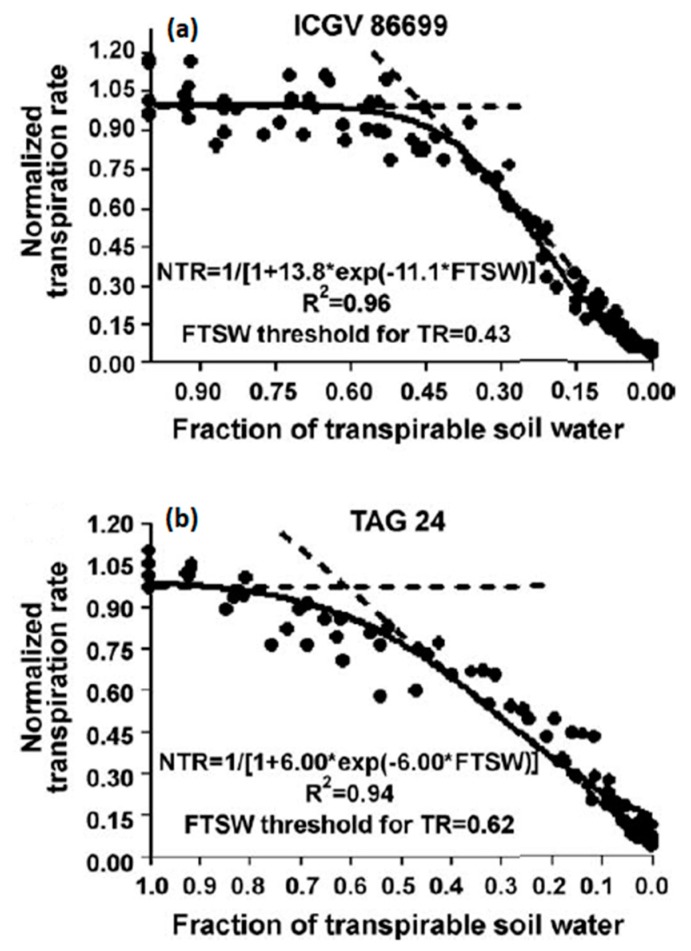
Figure 1.
Graph of normalized transpiration rate relative to the transpiration rate of well-watered plants for each genotype plotted against fraction of transpirable soil water for 6 week old peanut plants grown on mineral soil in 2.4 L pots [32]. These plants were subjected to controlled soil drying over about 2 weeks. The normalized was done to allow convenient comparison between genotypes ICGV 8699 (a) and TAG 24 (b).

