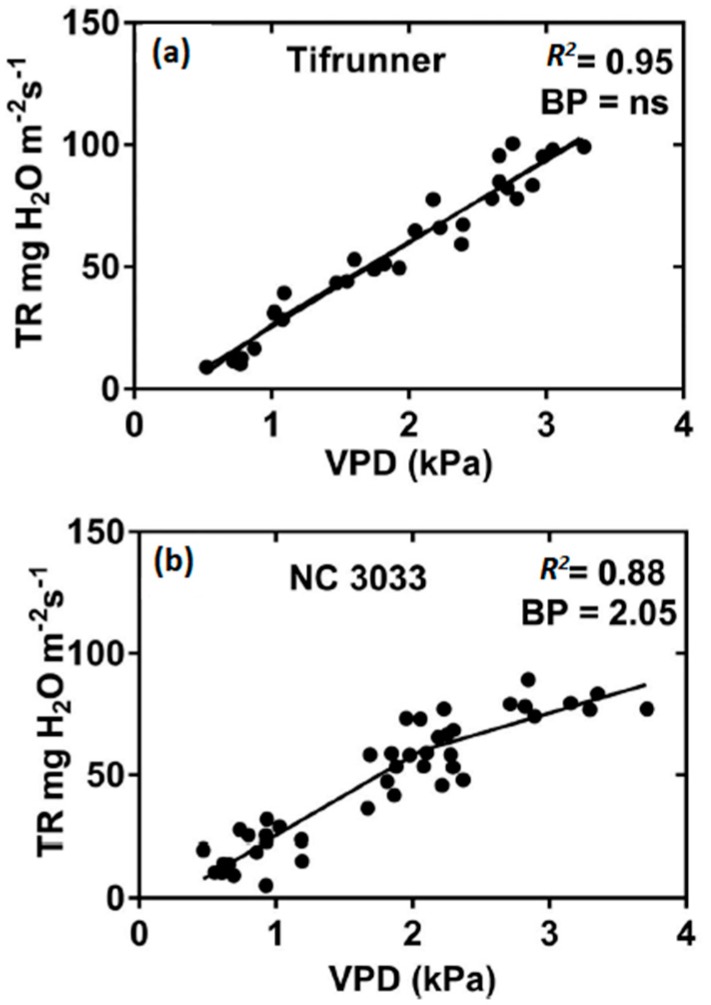
Figure 2.
Plot of transpiration rate (TR) vs. vapor pressure deficit (VPD) of 5 week old plants of (a) Tifrunner and (b) NC 3033 [37]. Entire plants were enclosed in individual mini-chambers (21 L) and TR was measured gravimetric for 1-exposure at each VPD. Regression analysis showed a linear increase in TR for Tifrunner over the entire range of tested VPD while a two-segment response was found for NC 3033 with a breakpoint (BP) between segments at 2.05 kPa.

