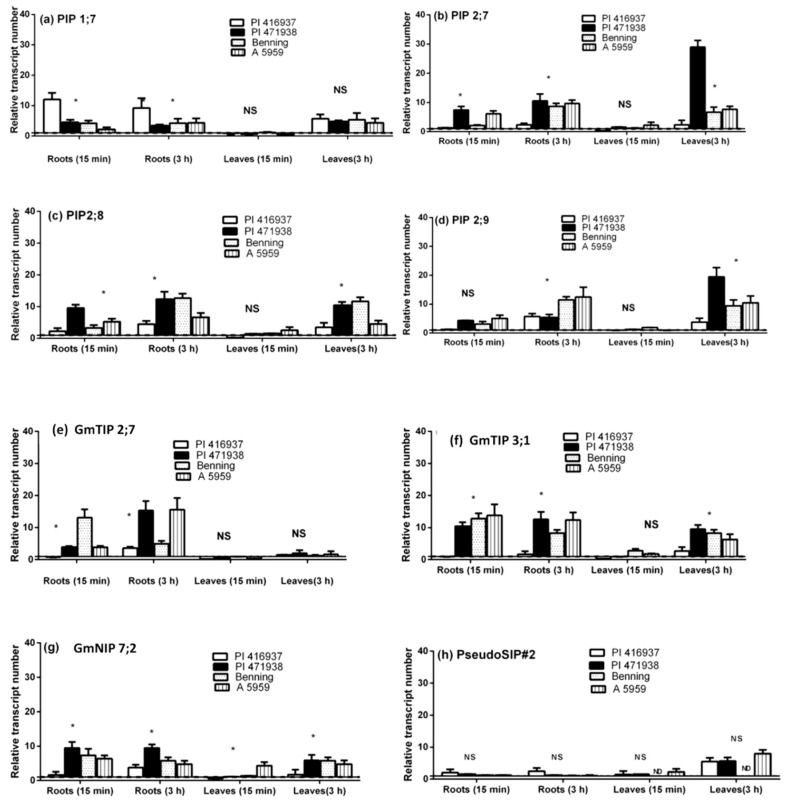
Figure 4.
RNA abundance response relative to untreated tissues 15 min and 180 min after treatment with 200 μM AQPs inhibitor [silver nitrate (AgNO3)] of eight AQPs: (a) PIP 1;7; (b) PIP 2;7; (c) PIP 2;8; (d) PIP 2;9; (e) GmTIP 2;7; (f) GmTIP 3;1; (g) GmNIP 7;2; and (h) PesudoSIP#2 in soybean roots and leaves [42]. Bars indicate transcript abundance ±S.E. Those noted with * are significantly different at P < 0.05, NS are non-significant and ND are not detectable.

