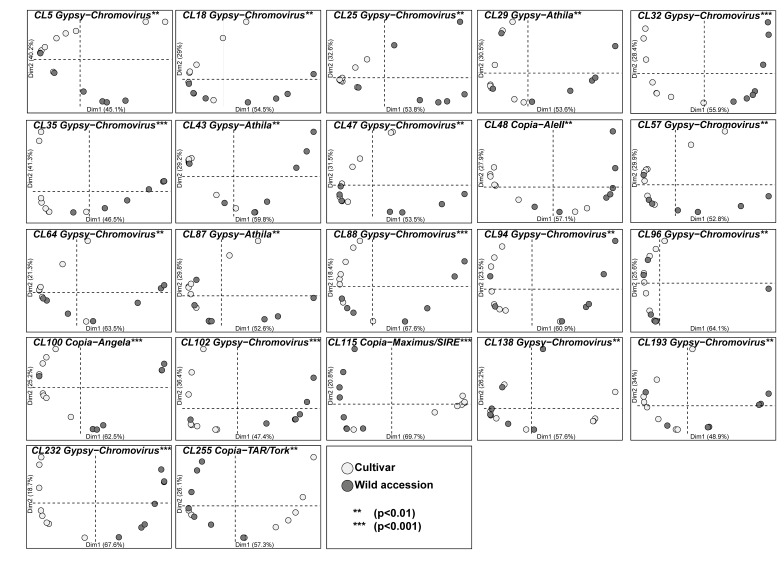
Figure 1.
Principal component analysis (PCA) plots of abundance values of 22 LTR-RE families in domesticated (white dots) and wild genotypes (grey dots) of Heliantus annuus. The percentage of variation accounted by each axis is shown. Asterisks indicate permutational multivariate analysis of variance (PERMANOVA) significance between cultivars and wild accessions: *** p < 0.001; ** p < 0.01.

