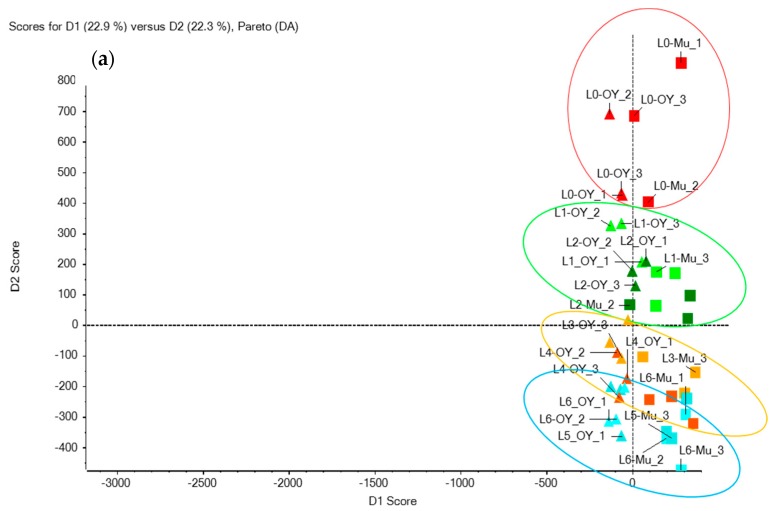
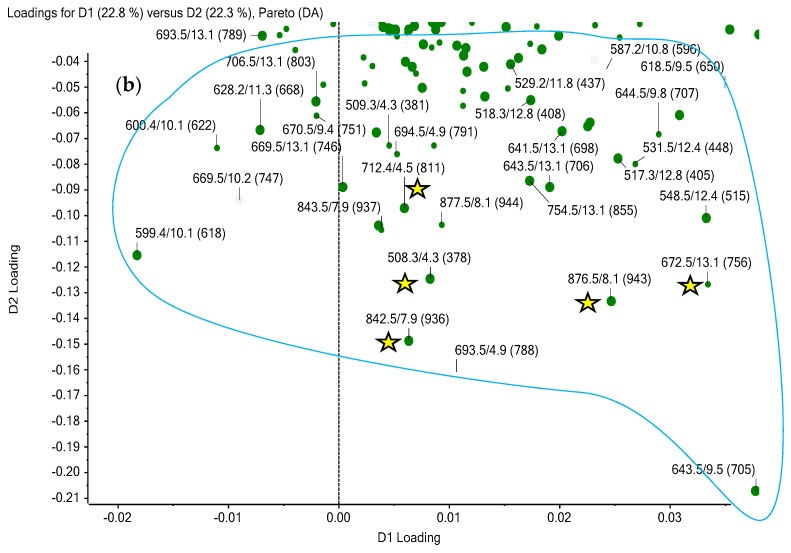
Figure 5.
(a) Scores plot of a supervised PCA-DA analysis of the data generated after analyzing contaminated and non-contaminated extracts (MeOH, mussel, and oyster) by LC-HRMS in ESI+ (in red: L0; green: L1 and L2; orange: L3 and L4; blue: L5 and L6); (b) Zoom at the corresponding loadings plot: ions circled in blue are the representative features (green dots) of the most contaminated level (L6). Ions corresponding to the toxins of interest are flagged with yellow stars. The three figures reported next to each green dot (such as 508.3/4.3 (378)) represent, respectively, the exact mass, the retention time, and the feature’s area (in brackets).


