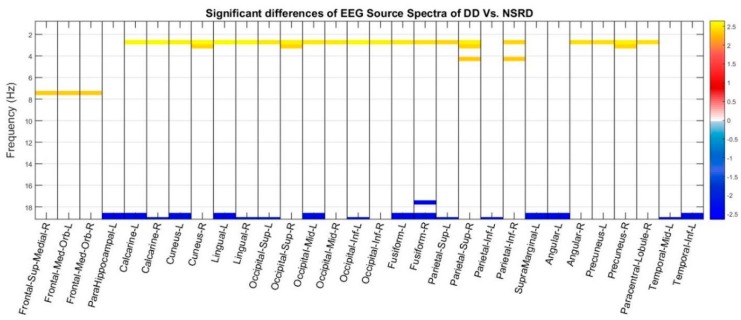
Figure 2.
Significant differences of the t test at the sources spectra of DD vs NSRD. Red and yellow values indicate an excess of DD compared to NSRD; values in the blue scale indicates excess of NSRD compared to DD. Threshold corrected by multiple comparisons. Differences are concentrated in very narrow bands of frequencies. In general, DD have an excess of slow activity (Delta and slightly Theta) and a defect of fast activity (Beta band).

