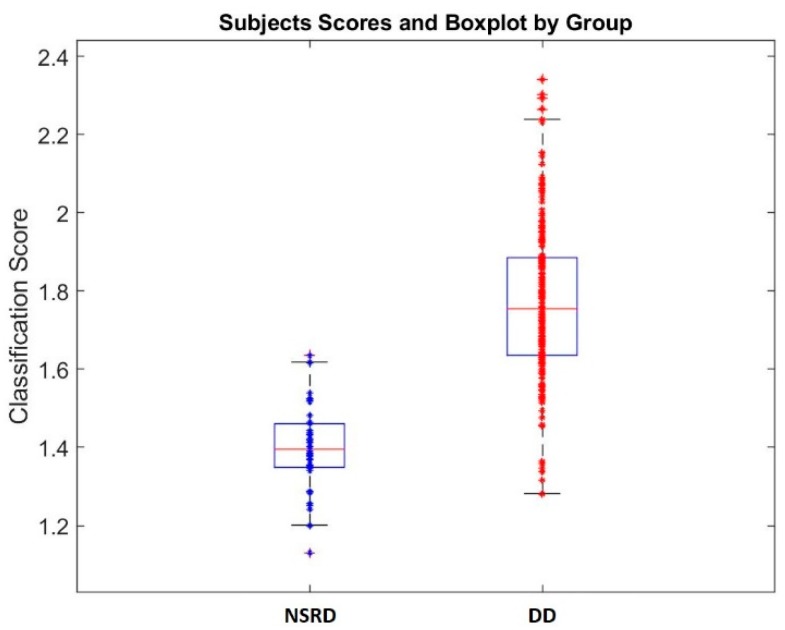
Figure 3.
Scatterplot showing the individual scores obtained by the classification equation of the DTRS variables, for the subjects of the two groups NSRD (unspecific reading delay) and DD (dysphonetic dyslexics). For each group a boxplot with the mean and standard deviation of the individual values is shown.

