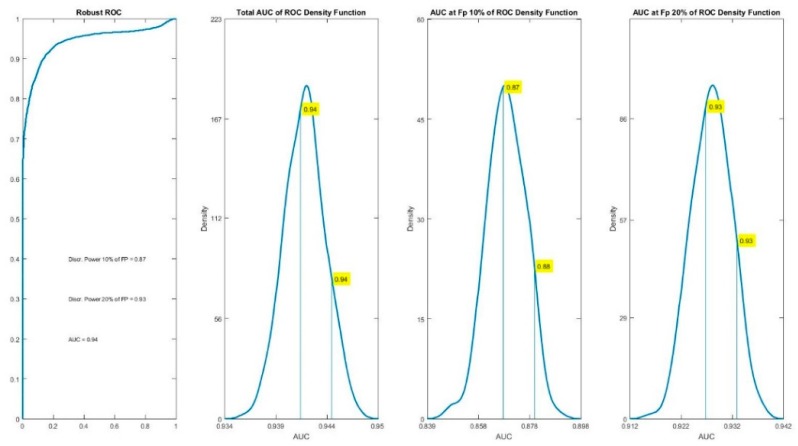
Figure 4.
rAUC for the classification equation showing a value of 0.94, which indicates almost perfect sensitivity and specificity. The three panels at the right show the density functions of the total rAUC as well as the discrimination power at the 10% and 20% of False Positives, obtained by the 500 random realizations. The discrimination power at the 50% of the density function was of 0.87 for the 10% of False Positives and 0.93 at the 20% of False Positives.

