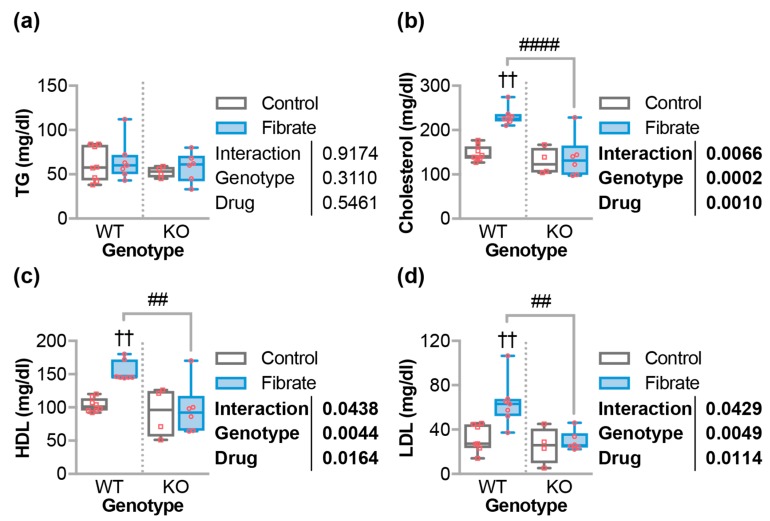
Figure 3.
Fenofibrate effects on circulating lipid levels. (a) Triglycerides (TG), (b) total cholesterol, (c) HDL cholesterol, and (d) LDL cholesterol in either wild-type (WT) or CHIP−/− (KO) mice fed control or fenofibrate chow, which is represented by a boxplot with biological replicates plotted. Results of two-way ANOVA are provided. Tukey’s post-test: †† indicate p < 0.01 comparing control vs. fibrate conditions. ## and #### indicate p < 0.01 and 0.0001 comparing WT vs. KO conditions.

