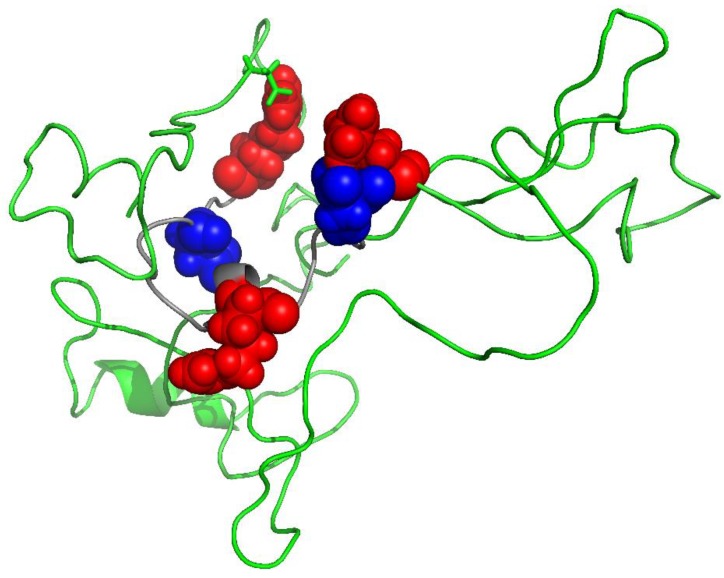
Figure 3.
MBP in MS patients is different from MBP in controls. Highlighted in red (Arg) and blue (Asp) are 5 amino acid residues that differ significantly within a 19 amino acid sequence. This cluster includes Arg 31, Asp 34, Arg 43, Asp 48, and Arg 49. For each site, the degree of change is greater in the MS patients; the only exception being Arg 31. Statistical data are shown in Figure 2 and are summarised from Friedrich et al. [9]. The model of MBP was generated using I-Tasser [25] and PyMOL Molecular Graphics System was used to render the 3D structure.

