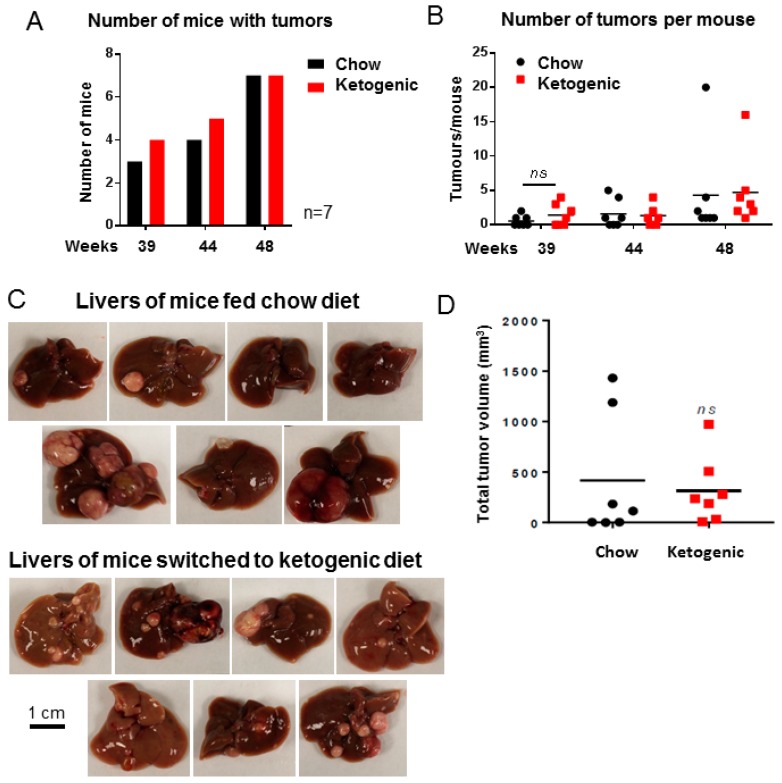
Figure 3.
Mice fed a ketogenic diet were not protected from tumor progression. (A) Number of mice with tumors visible by MRI at each time point (n = 7). (B) Number of tumors visible by MRI in each mouse liver (n = 7, ns = not significant, p = 0.9664). (C) Images of livers from all mice, fed either a chow or ketogenic diet. (D) Total tumor burden per mouse at necropsy (n = 7, ns = not significant, p = 0.7087). Data analysed by two-way ANOVA with Sidak’s multiple comparisons test (alpha = 0.05) for B and unpaired Student’s t test for D. Scale bar is 1 cm.

