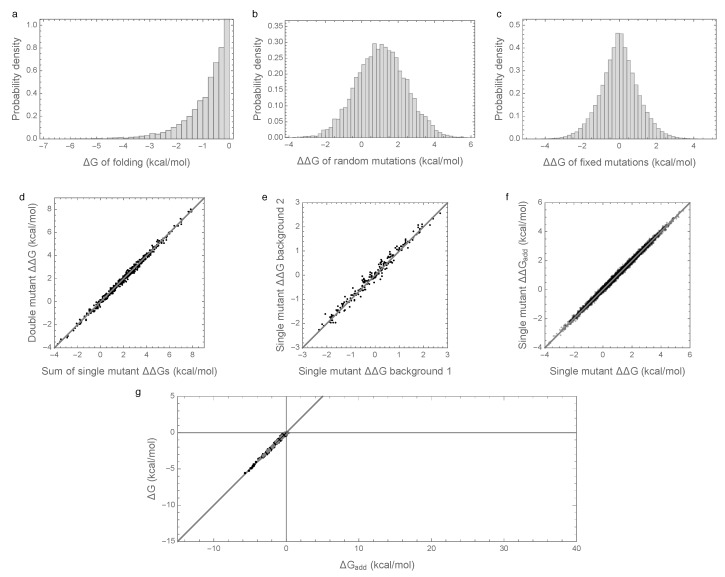
Figure 2.
Free energy of folding, stability effects of mutations, and contribution of additive effects to folding stability under the independent epistatic effects model: (a) Distribution of free energy of folding for evolved sequences; (b) distribution of stability effects of random mutations, i.e., distribution of values for a random single mutant generated from a random evolved sequence; (c) distribution of stability effects of fixed mutations, i.e., distribution of values corresponding to two distinct neighboring sequences along the simulated trajectory; (d) stability effects of double mutations versus the sum of the stability effects of the two single mutations. 500 random double mutants are shown, ; (e) effects of single mutations that fixed along the trajectory in two evolved backgrounds that differ by 50% sequence divergence, ; (f) the stability effect of a random mutation on is highly correlated with the stability effect of the mutation on the additive contribution , ; (g) the additive contribution to folding is a good indicator of the total free energy of folding () and 95% of observed sequences can fold spontaneously based on the additive contribution alone. The dashed gray curve is derived from our bivariate normal approximation and is predicted to contain 95% of the evolved sequences. Simulations conducted under the independent epistatic effects model with , , and .

