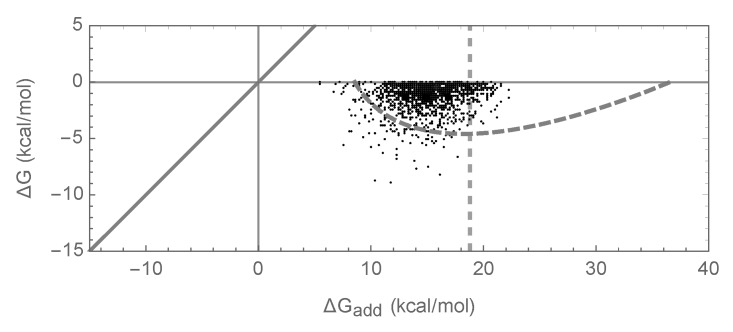
Figure 5.
Joint distribution of of folding and the additive contribution to of folding for the independent epistasis model with chosen so that the bivariate normal approximation matches the bivariate normal approximation shown in Figure 1g. Simulations conducted under the independent epistasis model with , , . A dashed curve shows the area predicted to include 95% of sequences at stationarity under the bivariate normal approximation; the dashed vertical line at reflects a value, derived using a crude percolation theory argument, for the right-most edge of the region where the bivariate normal approximation is expected to be valid.

