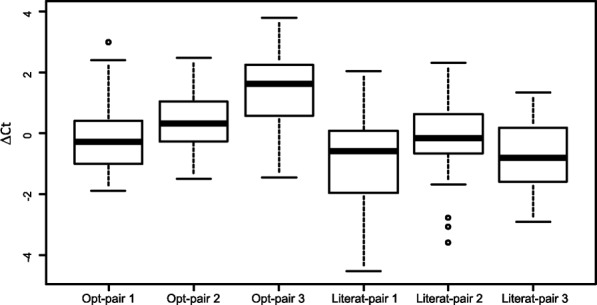
Fig. 2.

Boxplots of values demonstrating amplification of 16S DNA from bacteria isolates. Primer sets 1, 2 and 3 (Table 2) and three primer pairs from the literature (Forward: Bact-0008-b-S-2 - Reverse: Bact-0785-a-A-21; Forward: Bact-0347-a-S-19; Reverse: Bact-1028-b-A-19; Forward: Bact-0337-a-S-20; Reverse: Bact-1046-a-A-19) were used as real-time PCR primer sets on a panel of bacteria isolated from clinical specimens, including representatives of common Gram-positive and Gram-negative human pathogens belonging to different genera and phyla (Additional file 1: Table S2). ΔCt values were calculated as the difference between the mean of threshold cycle (Ct) values calculated for each sample using different primer-pairs and the Ct value obtained using a specific primer-pair. Positive ΔCt values indicate higher efficiency than average; negative ΔCt values indicate lower efficiency than average
