Fig. 2.
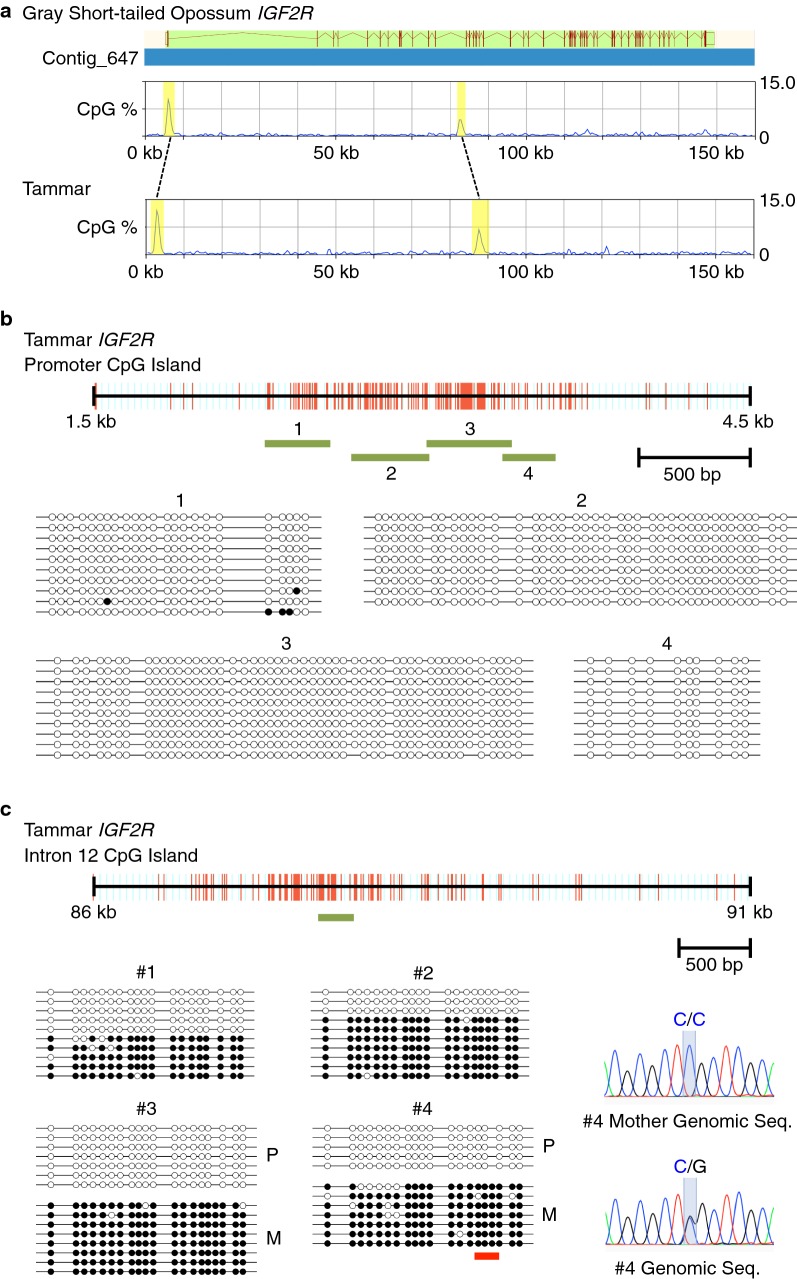
DNA methylation analysis in tammar IGF2R. a Location of CpG islands in opossum and tammar IGF2R. The graphs show the density of CpG sites in genomic sequences including opossum and tammar IGF2R, respectively. The yellow highlighted peaks in the graphs indicate the promoter and intron 12 CpG islands in opossum IGF2R and the orthologous CpG islands detected in tammar IGF2R genomic sequence. b DNA methylation analysis of promoter CpG island in tammar IGF2R. The red bars indicate each CpG site in 3 kb genomic sequence including the tammar IGF2R promoter CpG island. The green lines represent the regions analysed by bisulphite sequencing. Open circle; unmethylated CpG site, filled circle; methylated CpG site. c DNA methylation analysis of intron 12 CpG island in tammar IGF2R. The red line in #4 data represents the location of a single nucleotide polymorphism. Direct sequencing of PCR products amplified from the mother’s genomic DNA clarified maternal allele-specific DNA methylation

