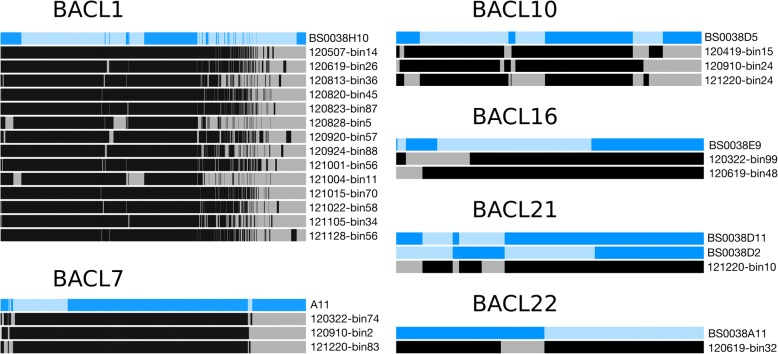
Fig. 1.
Gene homolog presence per genome cluster. Presence of gene homologs for each genome cluster by graphs produced by Anvi’o. Each horizontal bar represents one genome, where blue bars are single-amplified genomes and black and grey bars are metagenome-assembled genomes. Each vertical bar corresponds to one gene homolog where a dark vertical bar indicates presence of the gene homologs and a lighter vertical bar indicates absence. The gene homologs are aligned between genomes within each genome cluster. The numbers assigned to the genome clusters corresponds to the original MAG BACLs used in [23]

