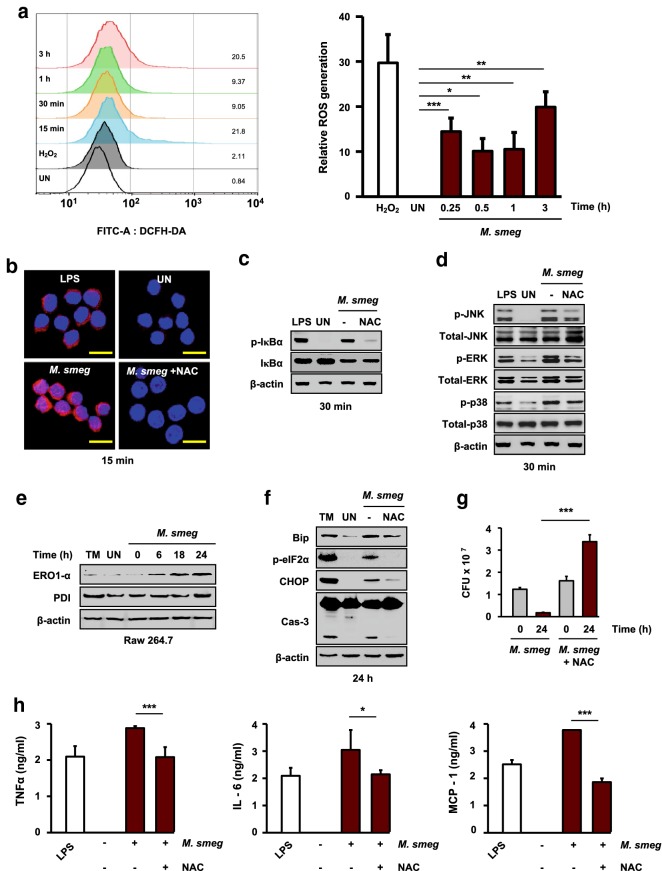
Fig. 4.
Phagocytosis and ROS induce the production of proinflammatory cytokines in M. smegmatis-infected macrophages. RAW 264.7 cells were infected with M. smegmatis (MOI = 5) for the indicated times. a Intracellular ROS levels were determined by DCFH-DA (5 μM) staining and FACS analysis. H2O2 (1 mM, 1 h) was used as the positive control. b RAW 264.7 cells were pretreated with NAC (30 mM) for 1 h before M. smegmatis infection. Intracellular ROS levels were determined by DHE (2 μM) staining (scale bar = 10 μm). c, d NAC-pretreated RAW 264.7 cells were infected with M. smegmatis for 30 min. NF-κB and MAPK activation was measured by western blot analysis. e Western blot analysis was performed using specific antibodies against ERO1-α and PDI. NAC-pretreated RAW 264.7 cells were infected with M. smegmatis (MOI = 5) for 24 h. f Western blot analysis was performed using specific antibodies against Bip, p-eIF2α, CHOP, and caspase-3. g Numbers of intracellular M. smegmatis in RAW 264.7 cells were determined by plate counting. h Inflammatory cytokine levels were determined by ELISA at 24 h. LPS (500 ng/mL, 24 h) was used as the positive control. Data are means ± SDs of at least three independent experiments. *p < 0.05, **p < 0.01, ***p < 0.001. M. smeg, Mycobacterium smegmatis; UN, uninfected; TM, tunicamycin; LPS, lipopolysaccharide; DCFH-DA, dichlorofluorescein diacetate; DHE, dihydroethidium; NAC, N-acetyl-cysteine

