
Fig. 3.
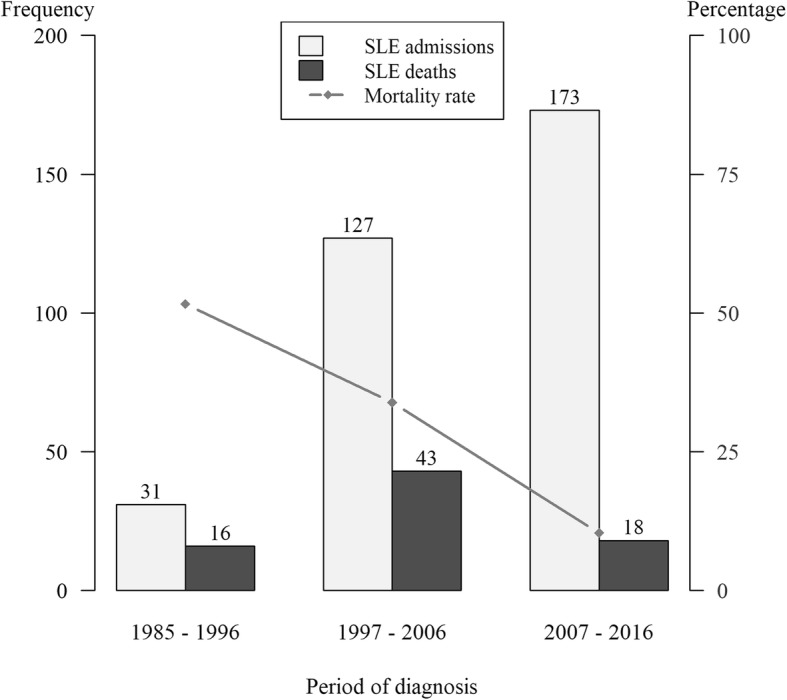
Comparison of SLE diagnosis and SLE-related death and mortality in the 3 study periods. Frequency (left vertical axis) refers to number of SLE admissions and deaths while the percentage (right vertical axis) refers to mortality rates
Official websites use .gov
A
.gov website belongs to an official
government organization in the United States.
Secure .gov websites use HTTPS
A lock (
) or https:// means you've safely
connected to the .gov website. Share sensitive
information only on official, secure websites.
Comparison of SLE diagnosis and SLE-related death and mortality in the 3 study periods. Frequency (left vertical axis) refers to number of SLE admissions and deaths while the percentage (right vertical axis) refers to mortality rates