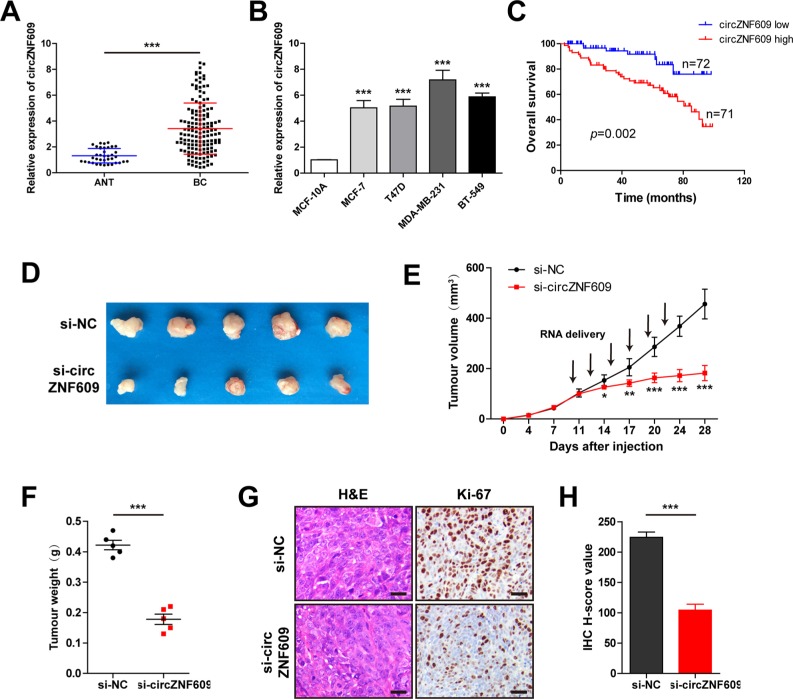
Figure 1.
The role of circZNF609 in breast cancer.
Notes: (A) qRT-PCR analysis of circZNF609 in BC tissues (n=143) and adjacent normal tissues (n=38). (B) qRT-PCR analysis of circZNF609 in BC cell lines. (C) Kaplan–Meier plot of BC patients with low (n=72) or high (n=71) circZNF609 expression. Using median circZNF609 values as cutoff. (D) The images of subcutaneous tumor from two treatment groups (n=5). (E) Tumor volumes of nude mice were measured every 3–4 days. (F) Tumor weights of nude mice were measured on the 28th day. (G) Representative images of H&E staining for tissue morphology and IHC staining for proliferation (Ki-67). Scale bar=20 µm. (H) The statistical plots for Ki67 H-score in two treatment groups. *P<0.05, **P<0.01, ***P<0.001.
Abbreviations: ANT, adjacent normal tissue; BC, breast cancer; NC, negative control; IHC, immunohistochemistry; qRT-PCR, quantitative reverse transcription-PCR.

