Figure.

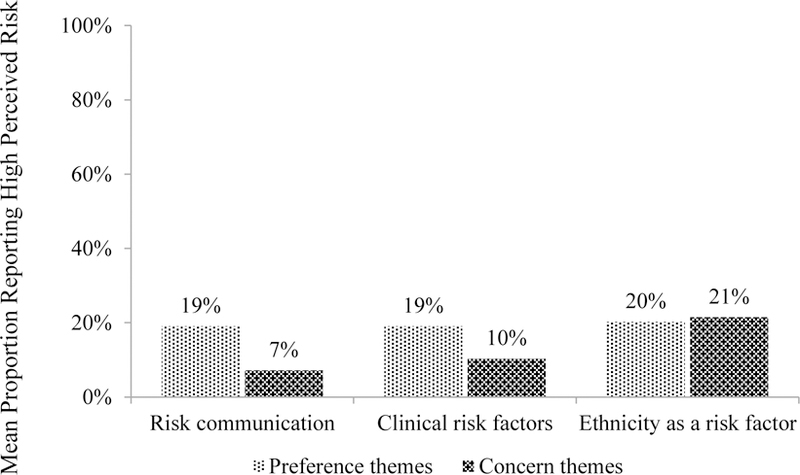
Joint Display of Quantitative Perceived Risk for Diabetes and Qualitative Risk-Related Themes (N=6 focus groups; N=35 participants)a,b
aBars indicate the mean proportion of women reporting high perceived risk for diabetes, across the focus groups in which each theme emerged.
bData are not mutually exclusive (eg, both preference and concern themes may have emerged in each focus group).
